Geckoboard is a real-time dashboard platform used by sales, marketing, support, and ops teams to display KPIs on TV screens and shared dashboards. Connecting Geckoboard to Parabola lets teams keep those dashboards fed with clean, blended data from across the business, without manual uploads or one-off scripts. Parabola handles the pulling, cleaning, and joining, then pushes the result straight into a Geckoboard dataset that any widget can read from.Documentation Index
Fetch the complete documentation index at: https://parabola.io/docs/llms.txt
Use this file to discover all available pages before exploring further.
Send to Geckoboard
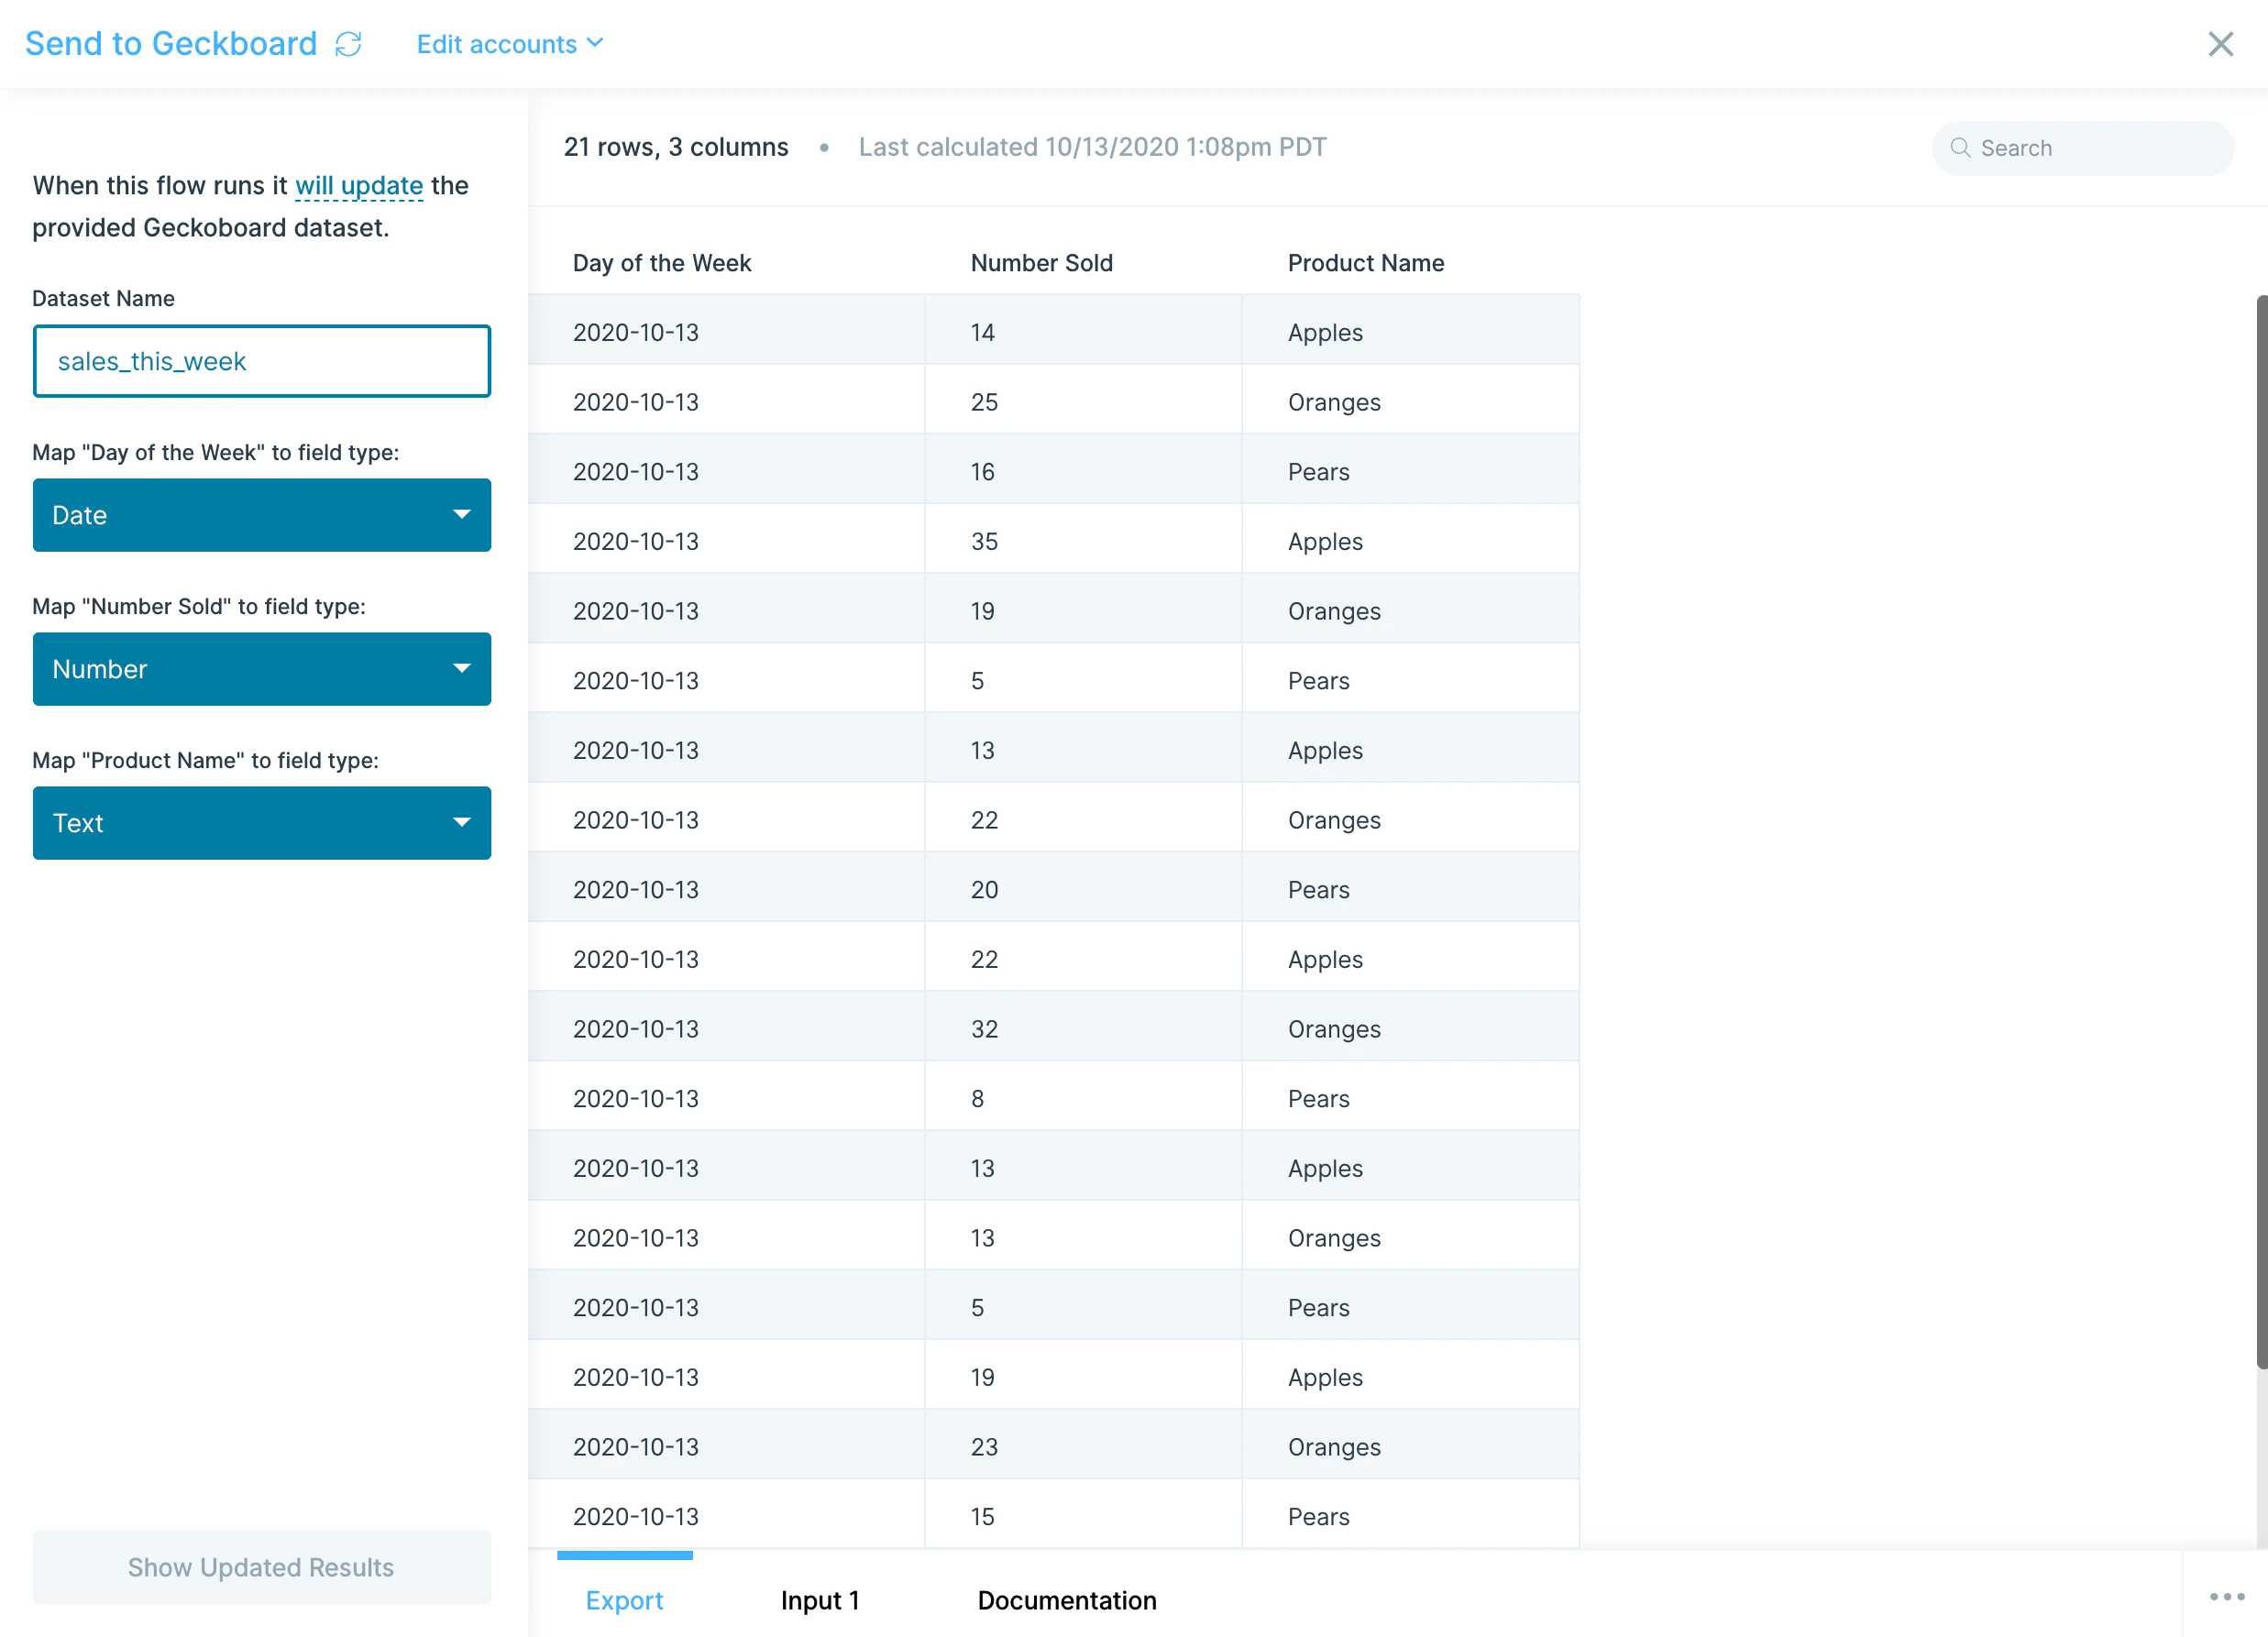
The Send to Geckoboard step pushes data from your flow into Geckoboard and updates the underlying dataset that powers your dashboard widgets. Each run of the flow refreshes the dataset, so a flow on an hourly schedule keeps the dashboard hourly-fresh.How to authenticate
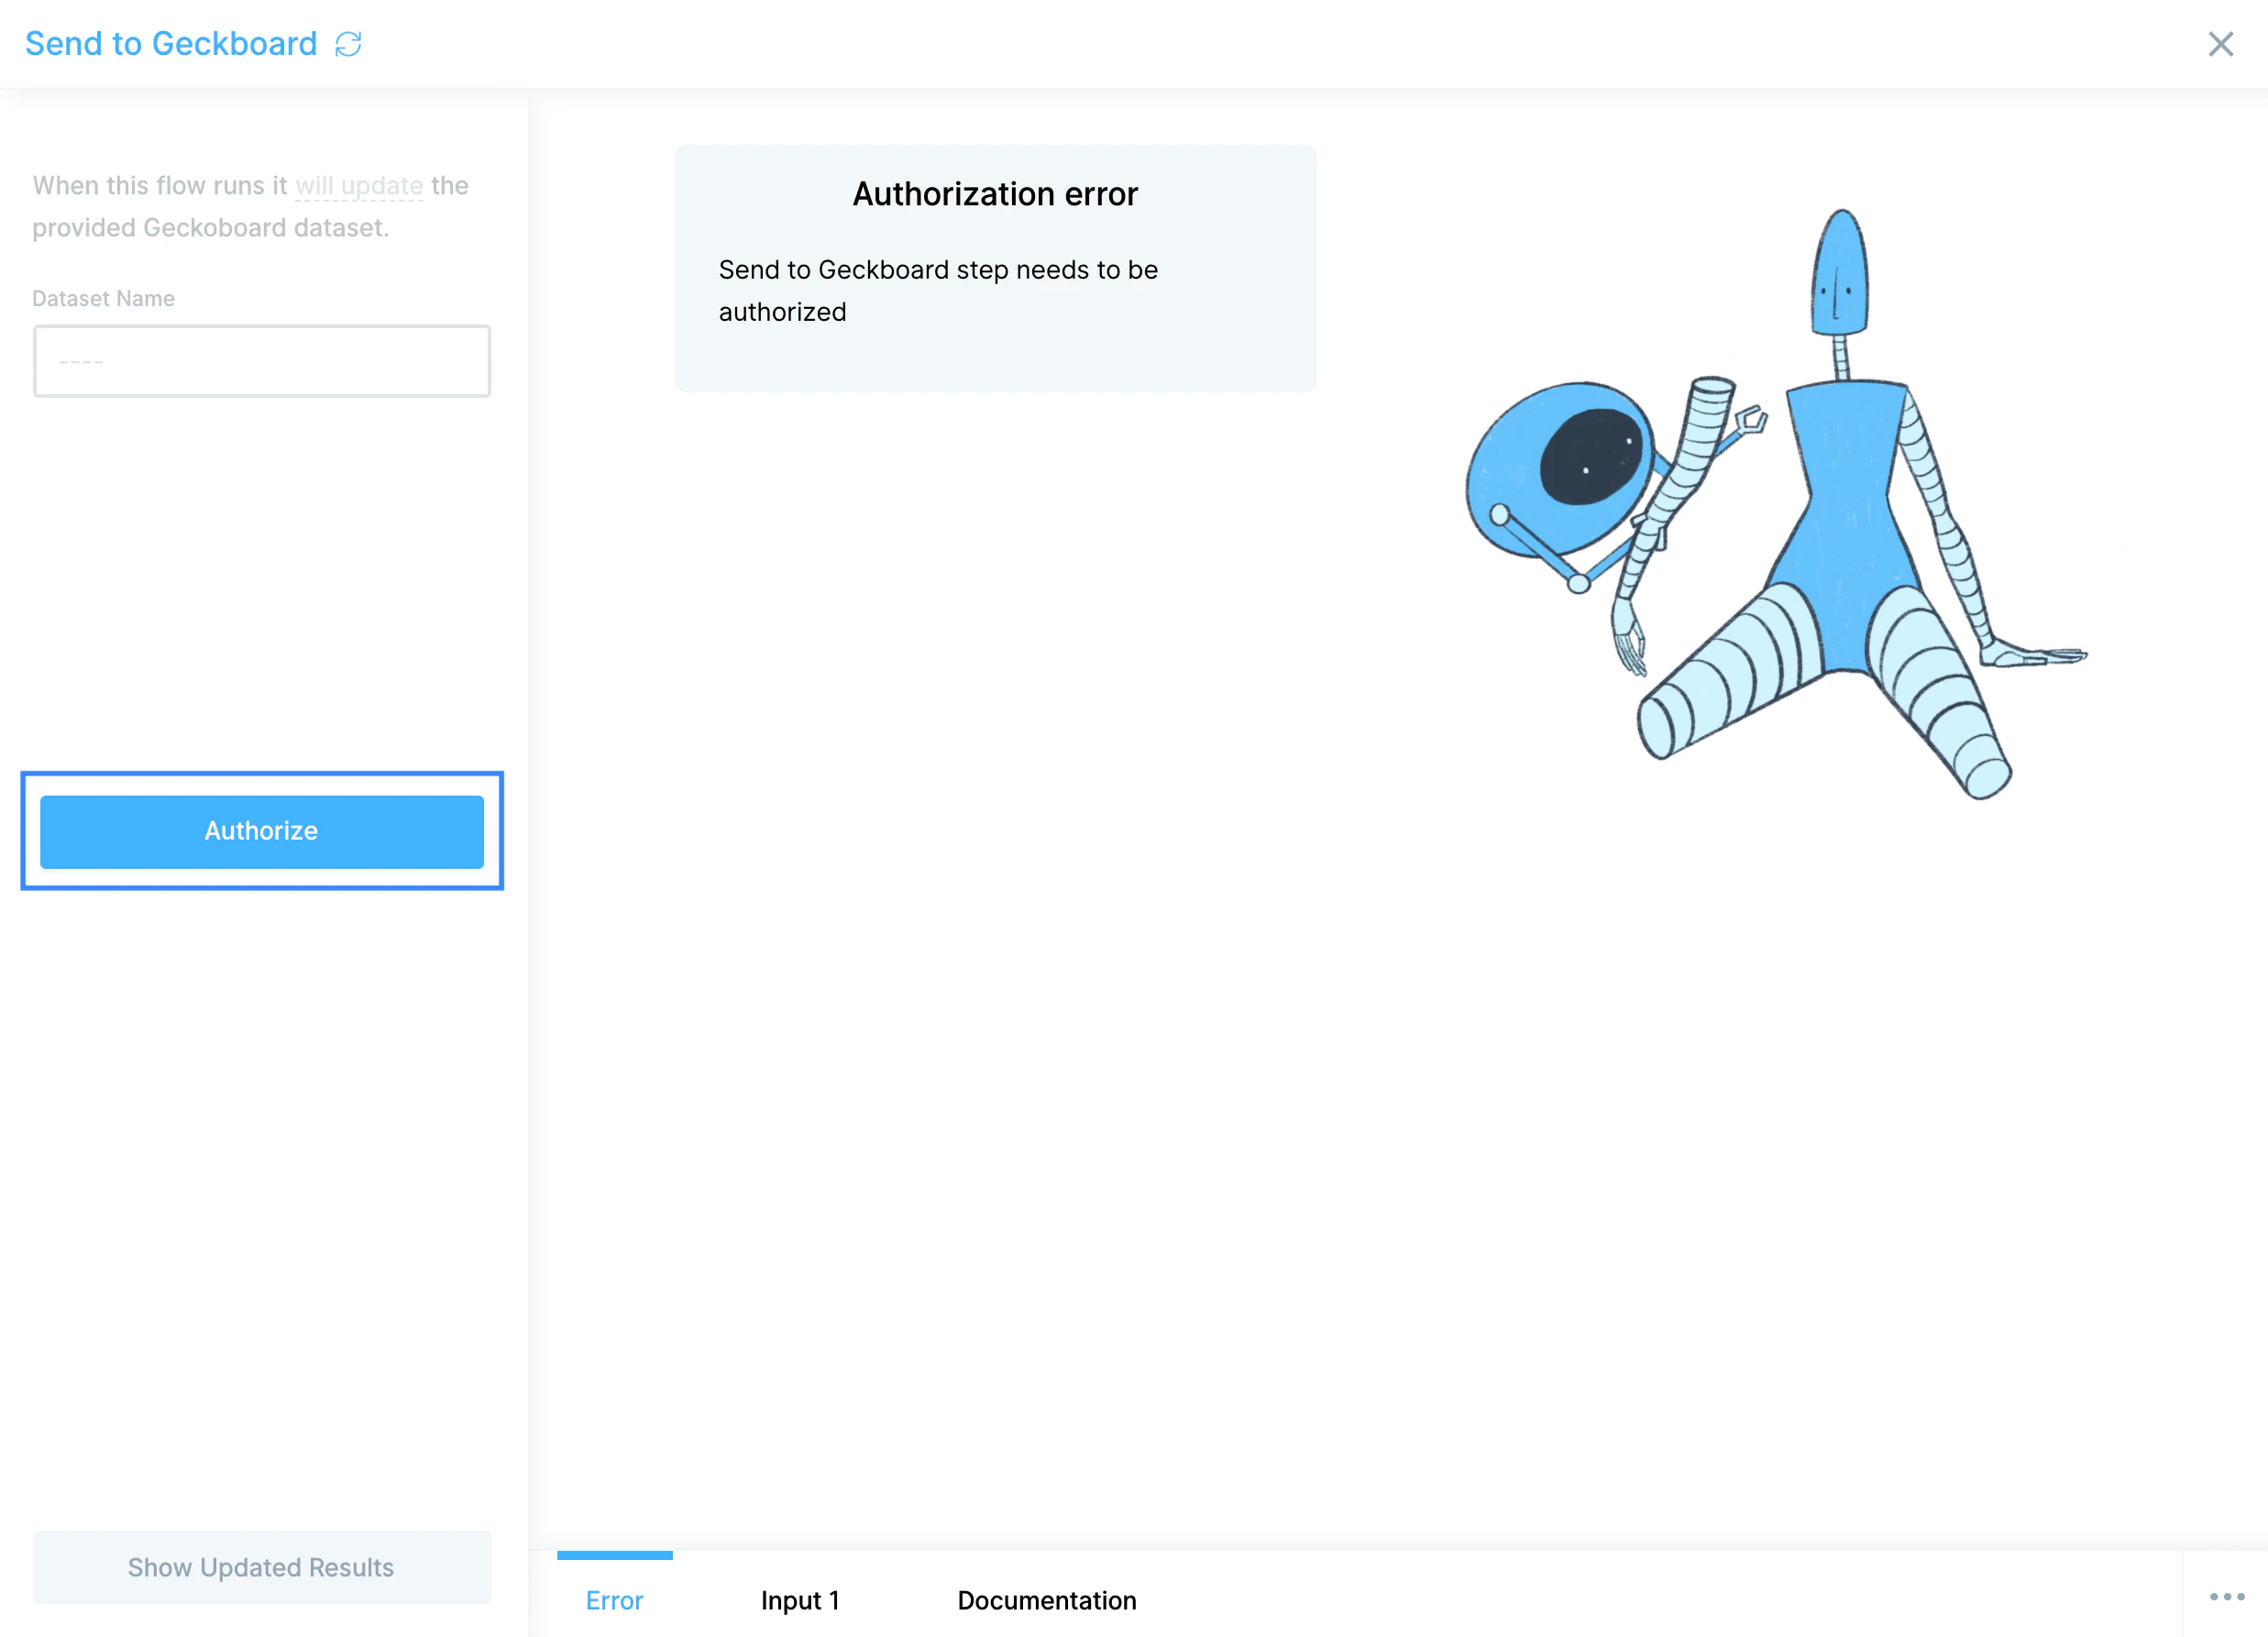
Look up your Geckoboard API Key on the account details page, copy it, and paste it into Parabola. Click Authorize to complete the connection.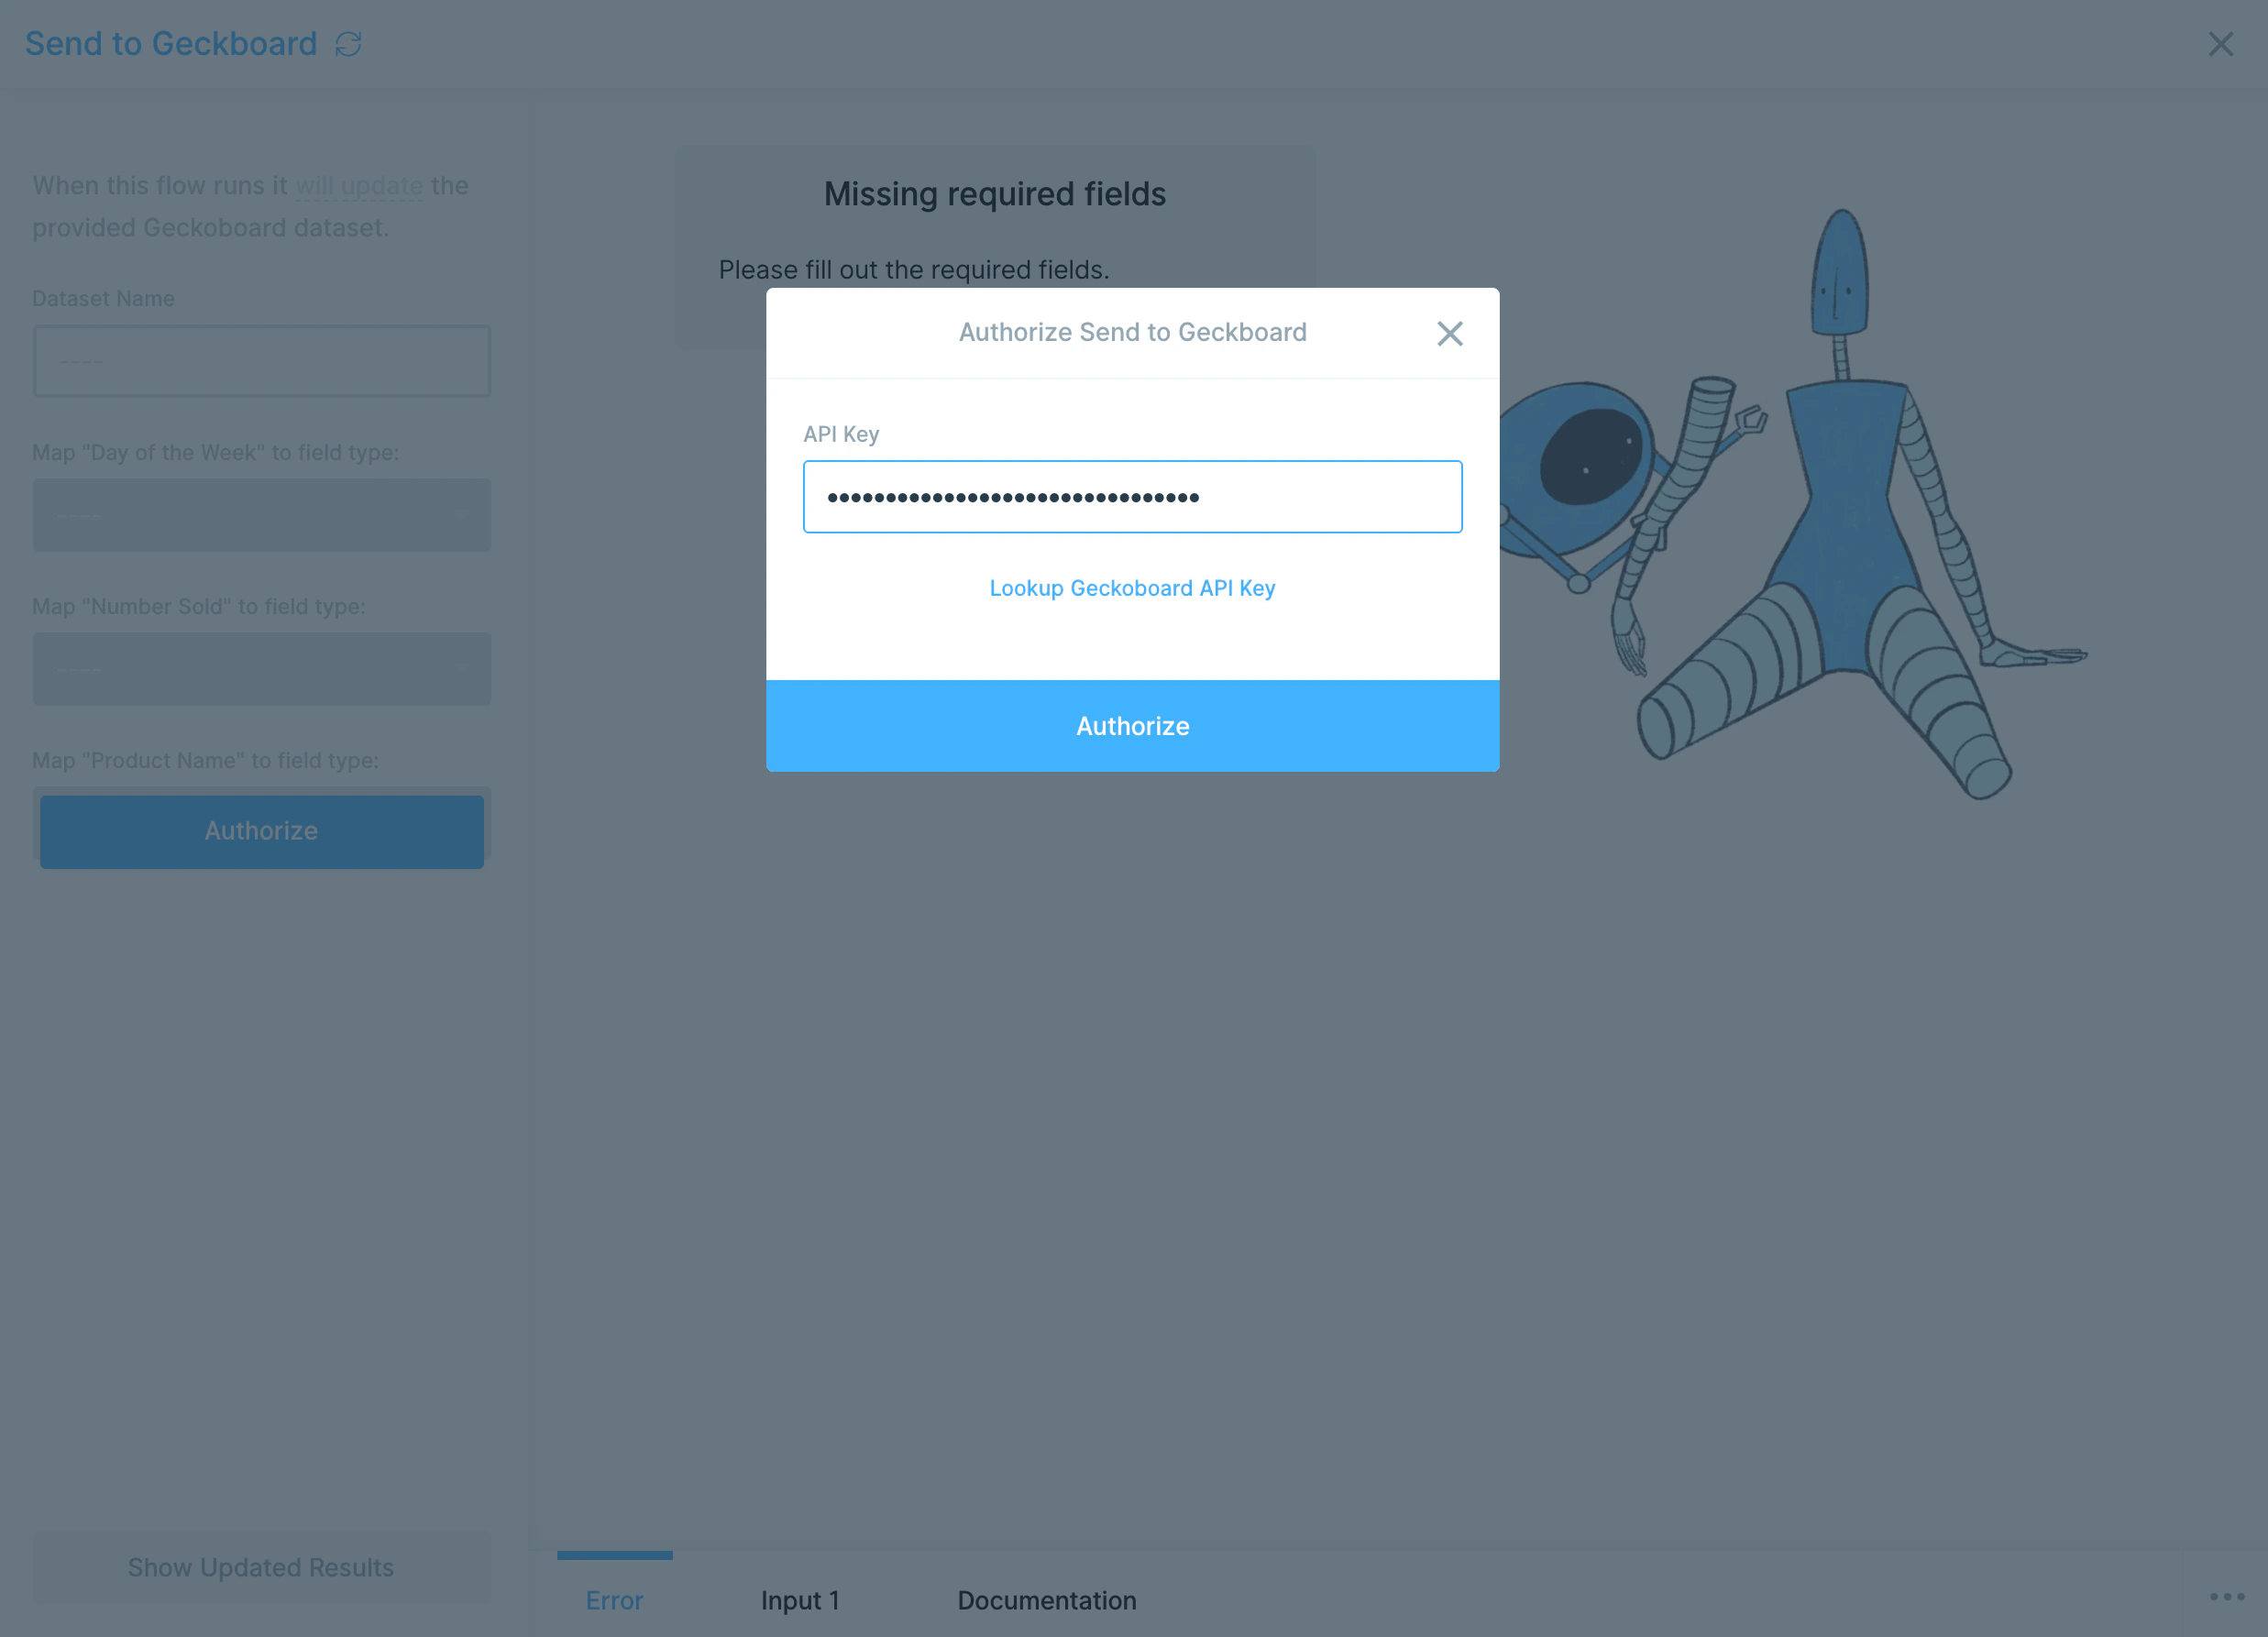
Configure your settings
First, choose a Dataset Name. Geckoboard requires lowercase letters and no spaces, so the field auto-formats whatever you type.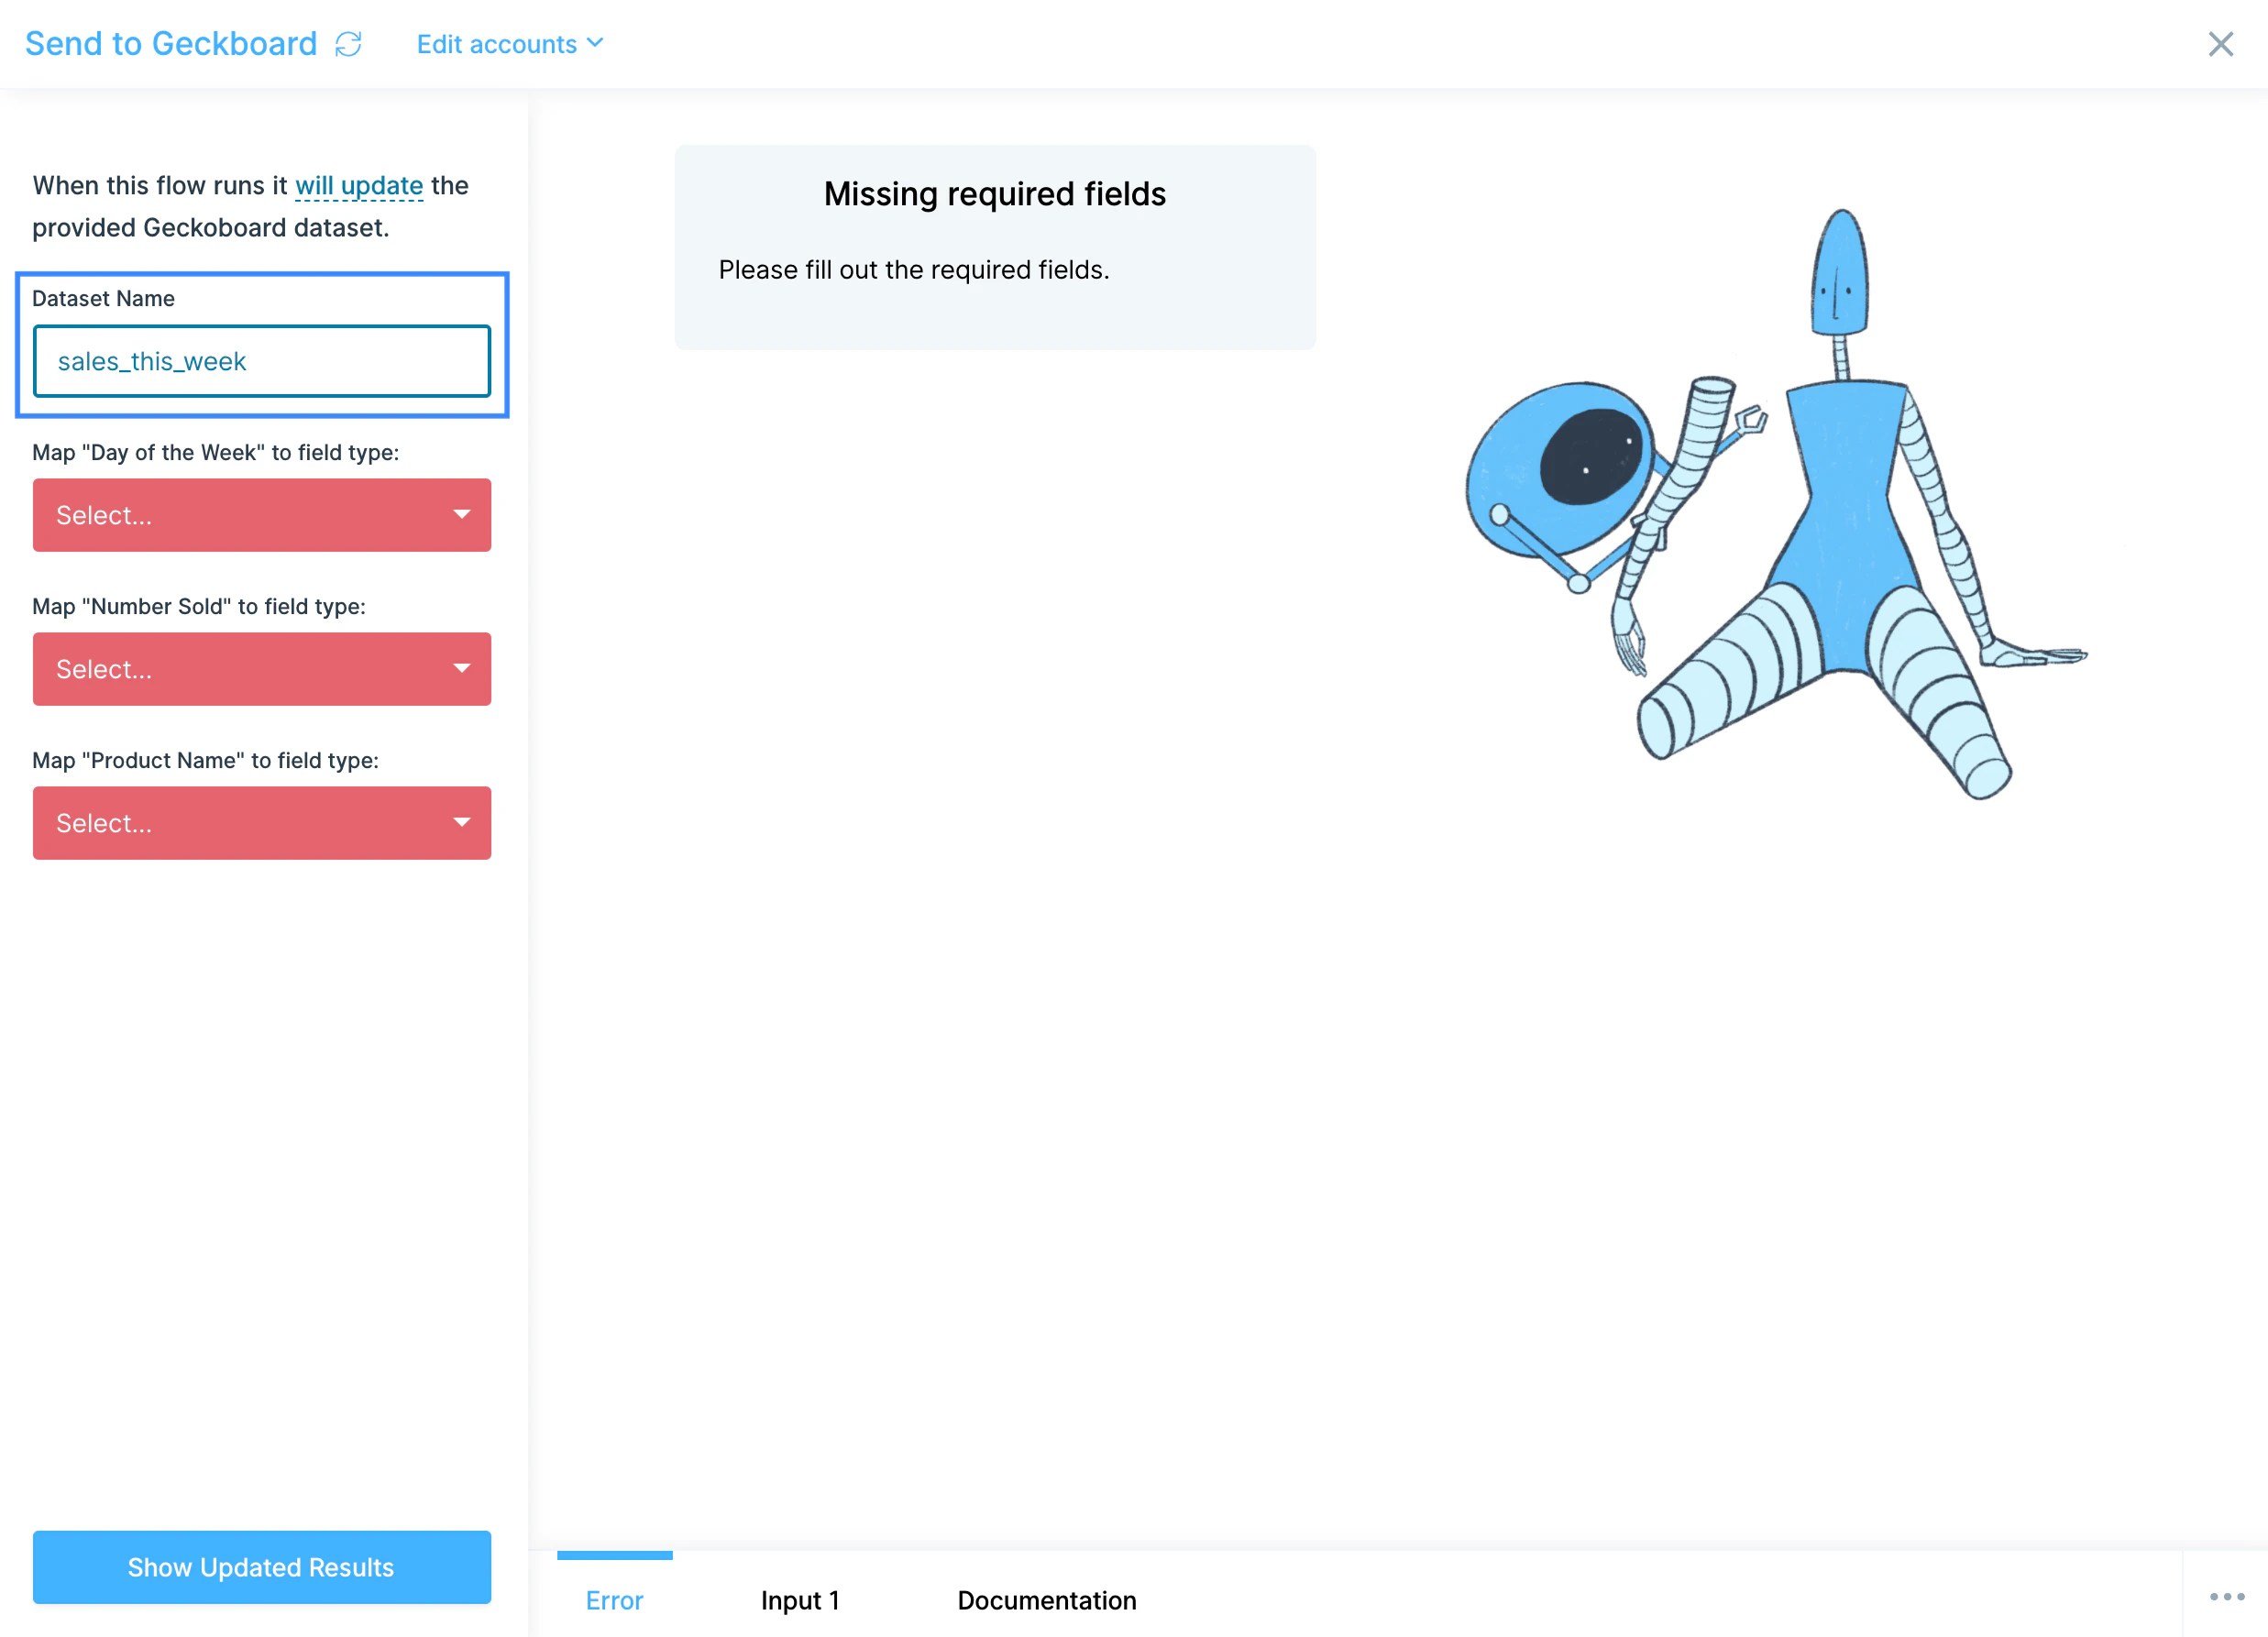
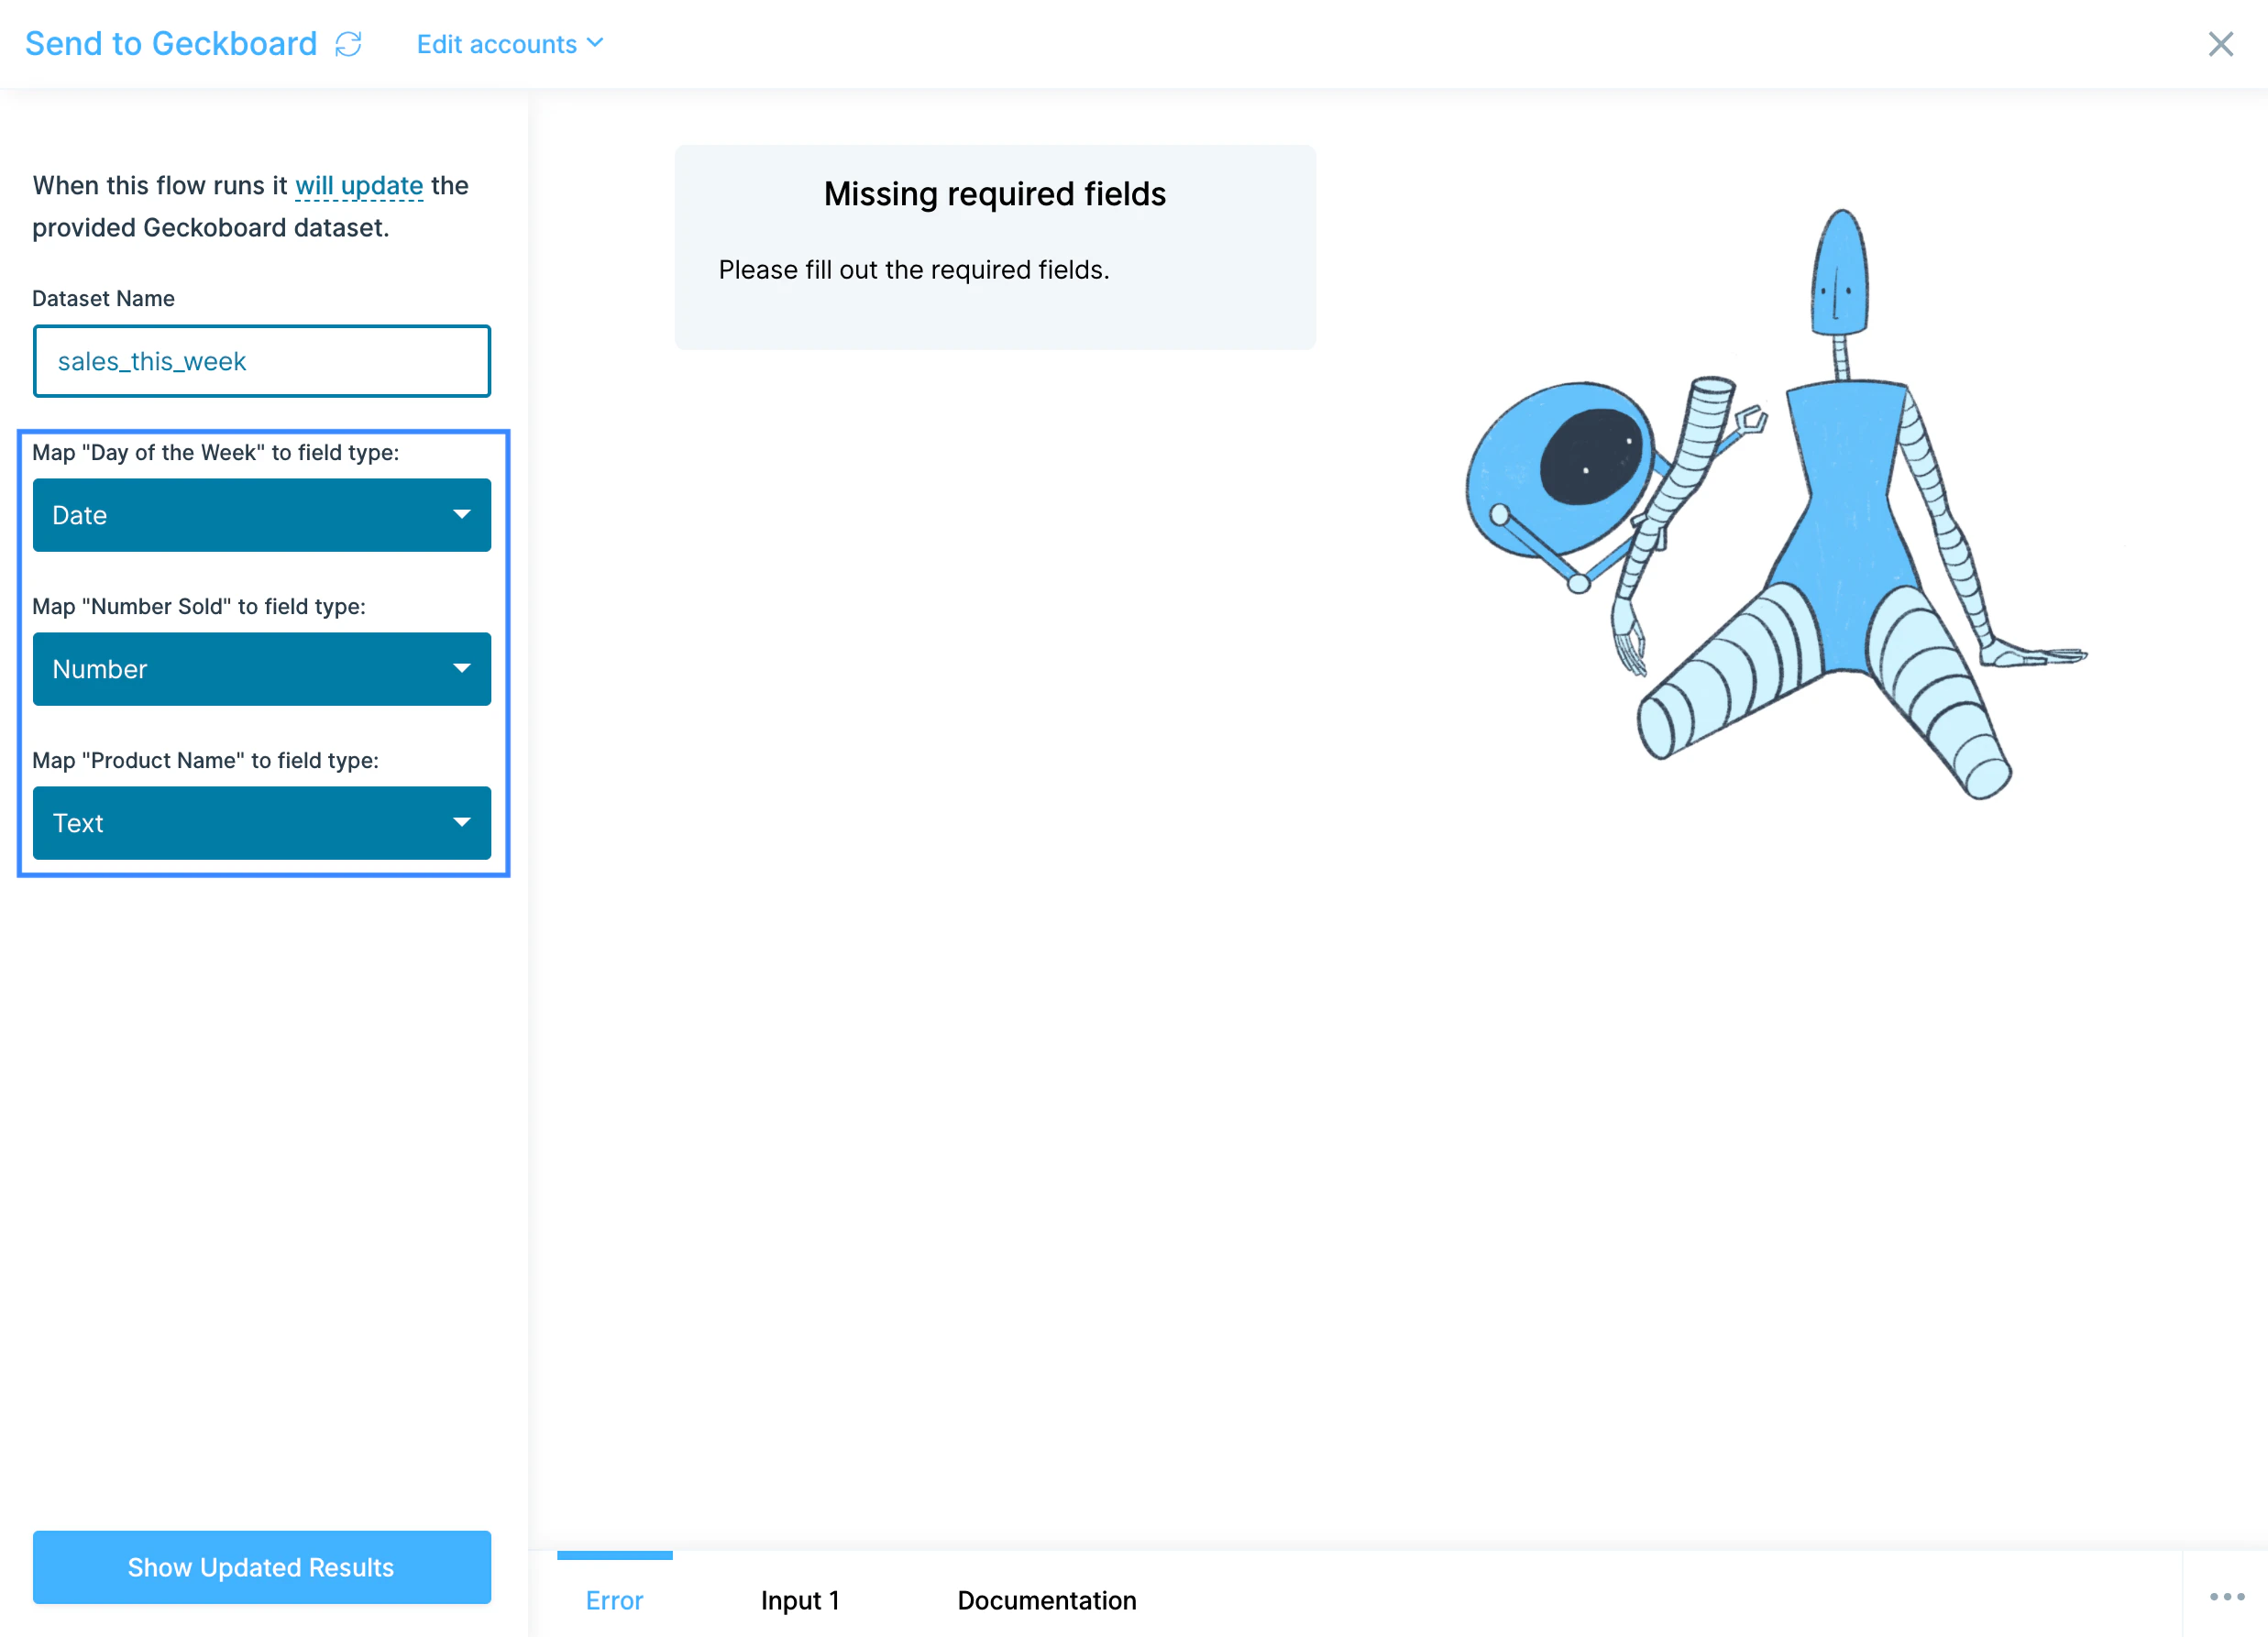
Available data types
Geckoboard datasets accept a few field types:- Date — required for any line chart widget. Must arrive in
YYYY-MM-DDformat. Use Parabola’s Format dates step to convert before sending. - Datetime — for timestamp-level data, in ISO 8601 format.
- Number — for any numeric metric that needs to be summed, averaged, or charted.
- Money — number values formatted as currency for display.
- Percentage — number values displayed as percentages.
- String — any text dimension you want to group by, such as region, channel, or product category.
Common use cases
- Multi-channel sales dashboards: Pull orders from Shopify, Amazon Seller Central, Walmart, and Squarespace, unify them, and push a single sales-by-channel dataset to Geckoboard for the leadership TV.
- Marketing performance dashboards: Combine campaign data from Mailchimp, Klaviyo, Facebook Ads, TikTok, and Google Analytics into a blended CAC and channel-ROI dashboard.
- Customer support dashboards: Push ticket volume, response times, and CSAT from Zendesk, Gorgias, or Front so the support team sees a live SLA board.
- Finance and AP dashboards: Roll up open bills, AR aging, and cash position from QuickBooks Online, NetSuite, Ramp, or Coupa and display them on a finance team dashboard.
- Shipping and ops dashboards: Combine carrier data from FedEx, UPS, DHL, and 3PL data from ShipBob or ShipStation into an on-time delivery and cost-per-shipment view.
- Cross-system KPIs from your warehouse: Pull pre-modeled metrics from Snowflake, BigQuery, or Redshift and push the latest snapshot into Geckoboard each hour.
Tips for using Parabola with Geckoboard
- Cap your row count. Geckoboard accepts a maximum of 5,000 rows per push. If your dataset exceeds that, group or aggregate upstream with a Group by step or use Remove rows to trim.
- Format dates as
YYYY-MM-DD. Geckoboard requires this format on Date fields. Use the Format dates step before the Send to Geckoboard step. - Drop columns you don’t need. Use Remove columns before the Send step to keep the dataset clean and lean. Fewer columns = faster pushes and clearer widget configuration.
- Use one dataset per dashboard concept. A “sales-by-channel” dataset and a “support-ticket-volume” dataset feed different widgets. Don’t try to cram unrelated metrics into one dataset.
- Schedule to match dashboard expectations. Hourly for live ops boards, daily for executive summaries, weekly for trend dashboards. Geckoboard simply reflects whatever the underlying dataset says.
- Add a refresh-time field. Including a “last updated” timestamp column gives you a way to display freshness on the dashboard, useful for catching broken flows.
FAQ
How often can I update a Geckoboard dataset?
As often as your Parabola flow runs. Each Parabola run replaces the dataset contents, so an hourly schedule produces an hourly-fresh dashboard.Can I add a new widget to my dashboard from a Parabola dataset?
Yes. In Geckoboard, when prompted to choose a source for a new widget, select Datasets and pick the dataset Parabola created.Why is my line chart not rendering?
Line charts require a column mapped to a Date type, inYYYY-MM-DD format. If your date column is text or in a different format, the chart won’t render. Add a Format dates step in Parabola to fix it.
What happens if I send more than 5,000 rows?
Geckoboard rejects pushes larger than 5,000 rows. Aggregate or filter the dataset upstream so each push fits within the limit.With Geckoboard and Parabola connected, the live KPI dashboards your team relies on stay current automatically, with the cleaning and blending logic handled in Parabola and the visualization handled in Geckoboard.