Documentation Index
Fetch the complete documentation index at: https://parabola.io/docs/llms.txt
Use this file to discover all available pages before exploring further.
Input/output
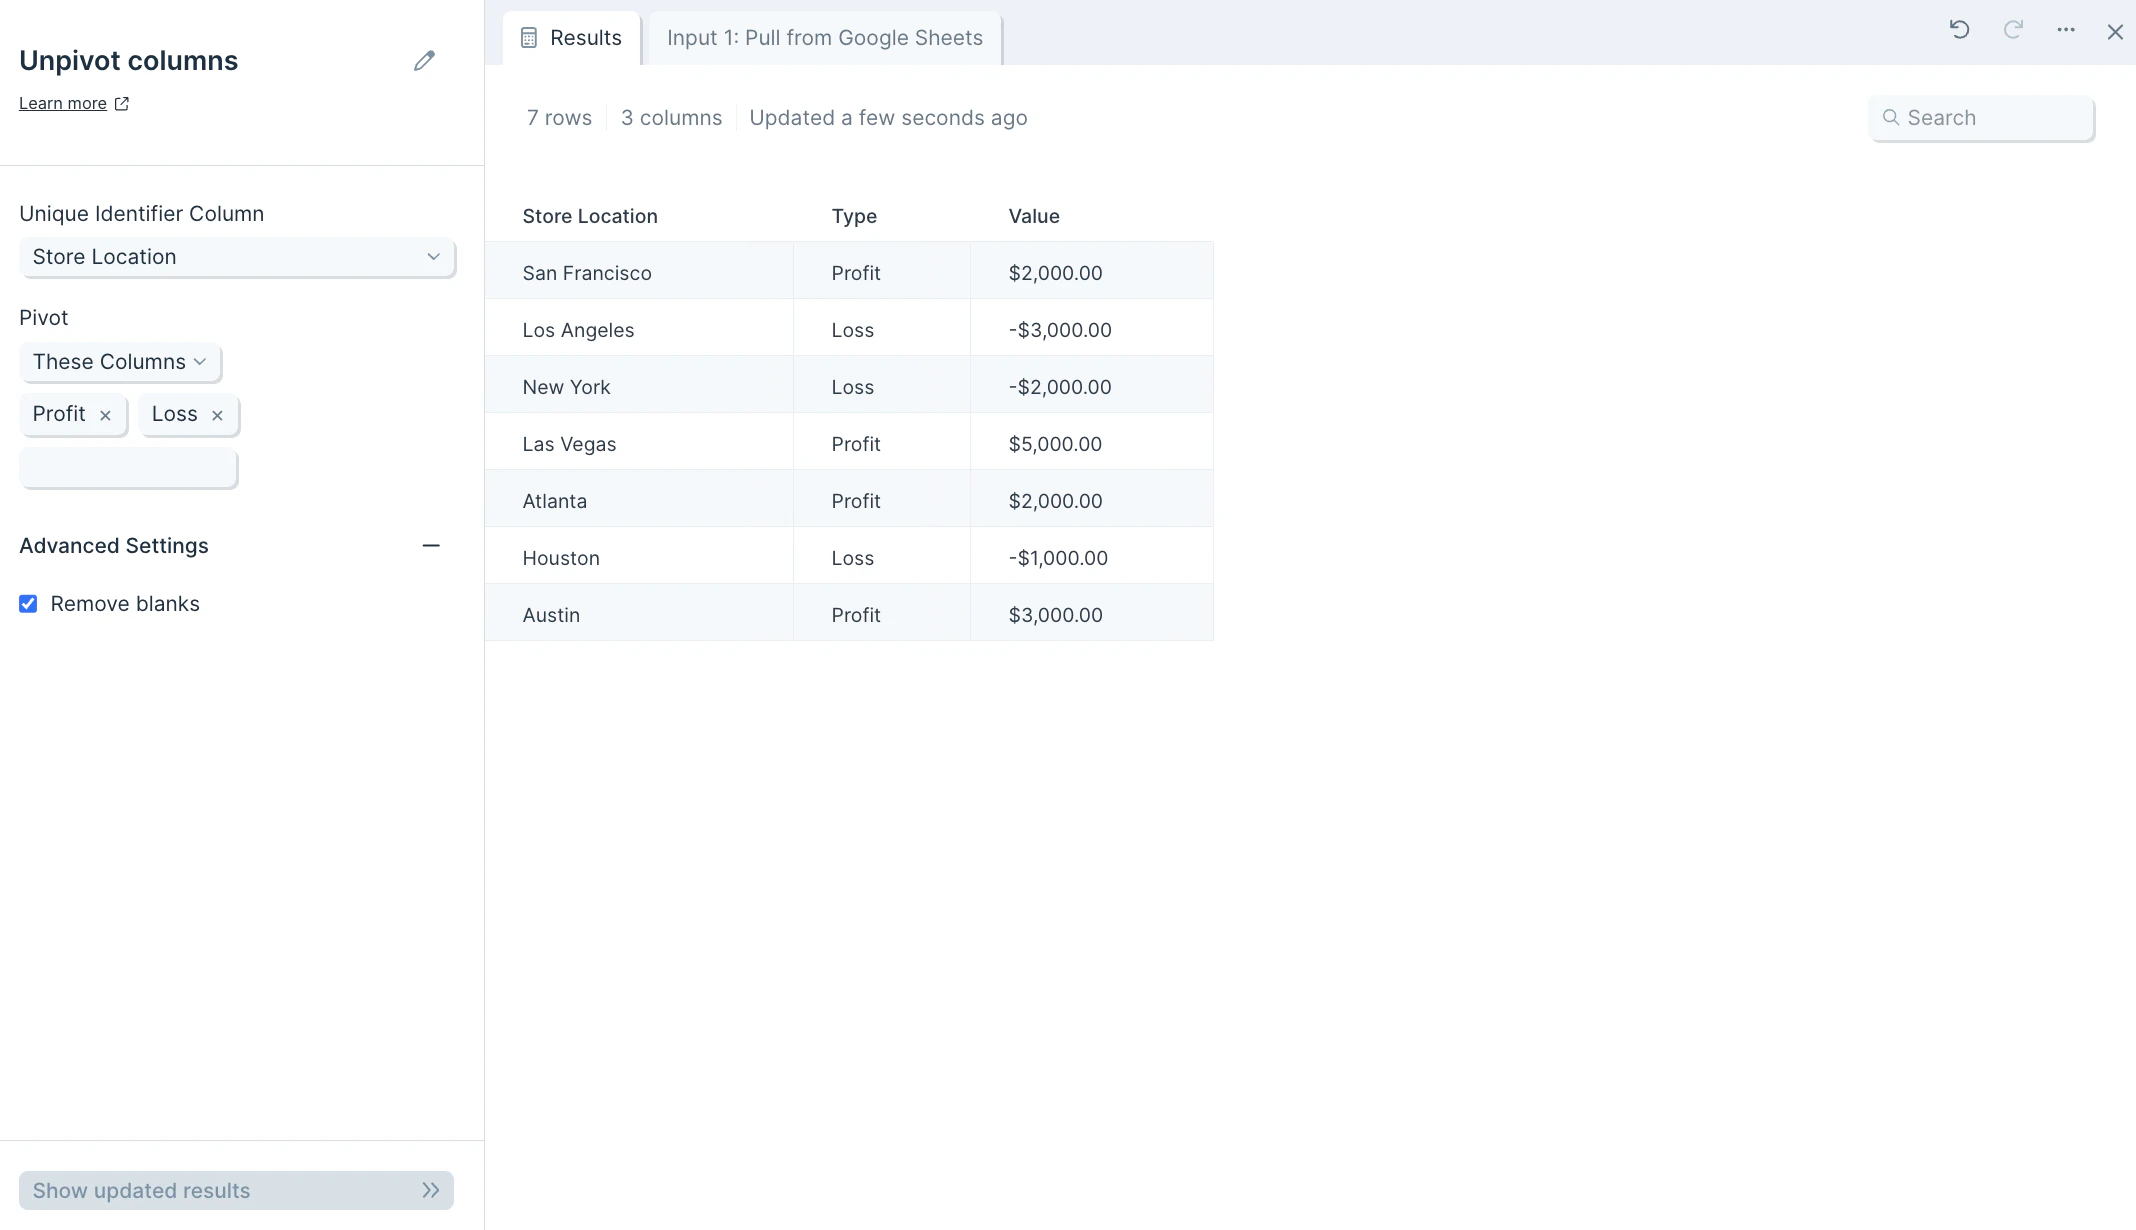
The input data we’ll use for this step is a table of three columns: “Store Location”, “Profit”, and “Loss”.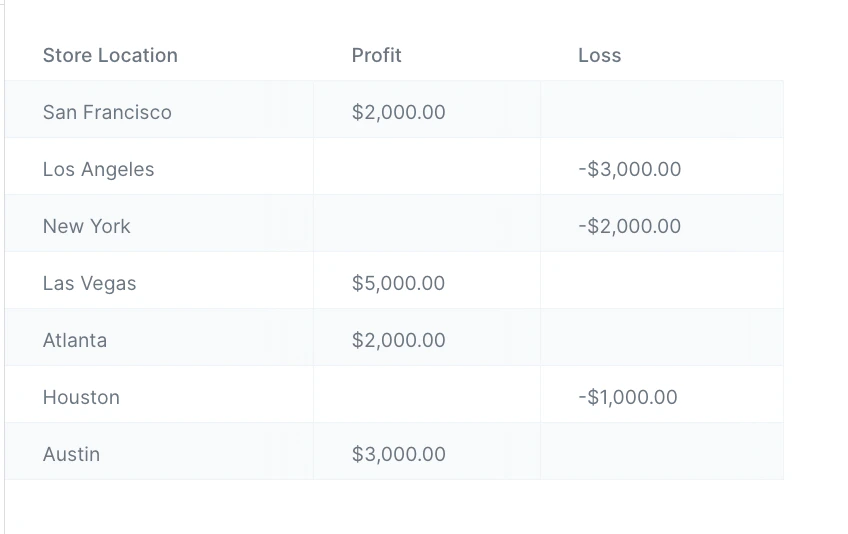
Custom settings
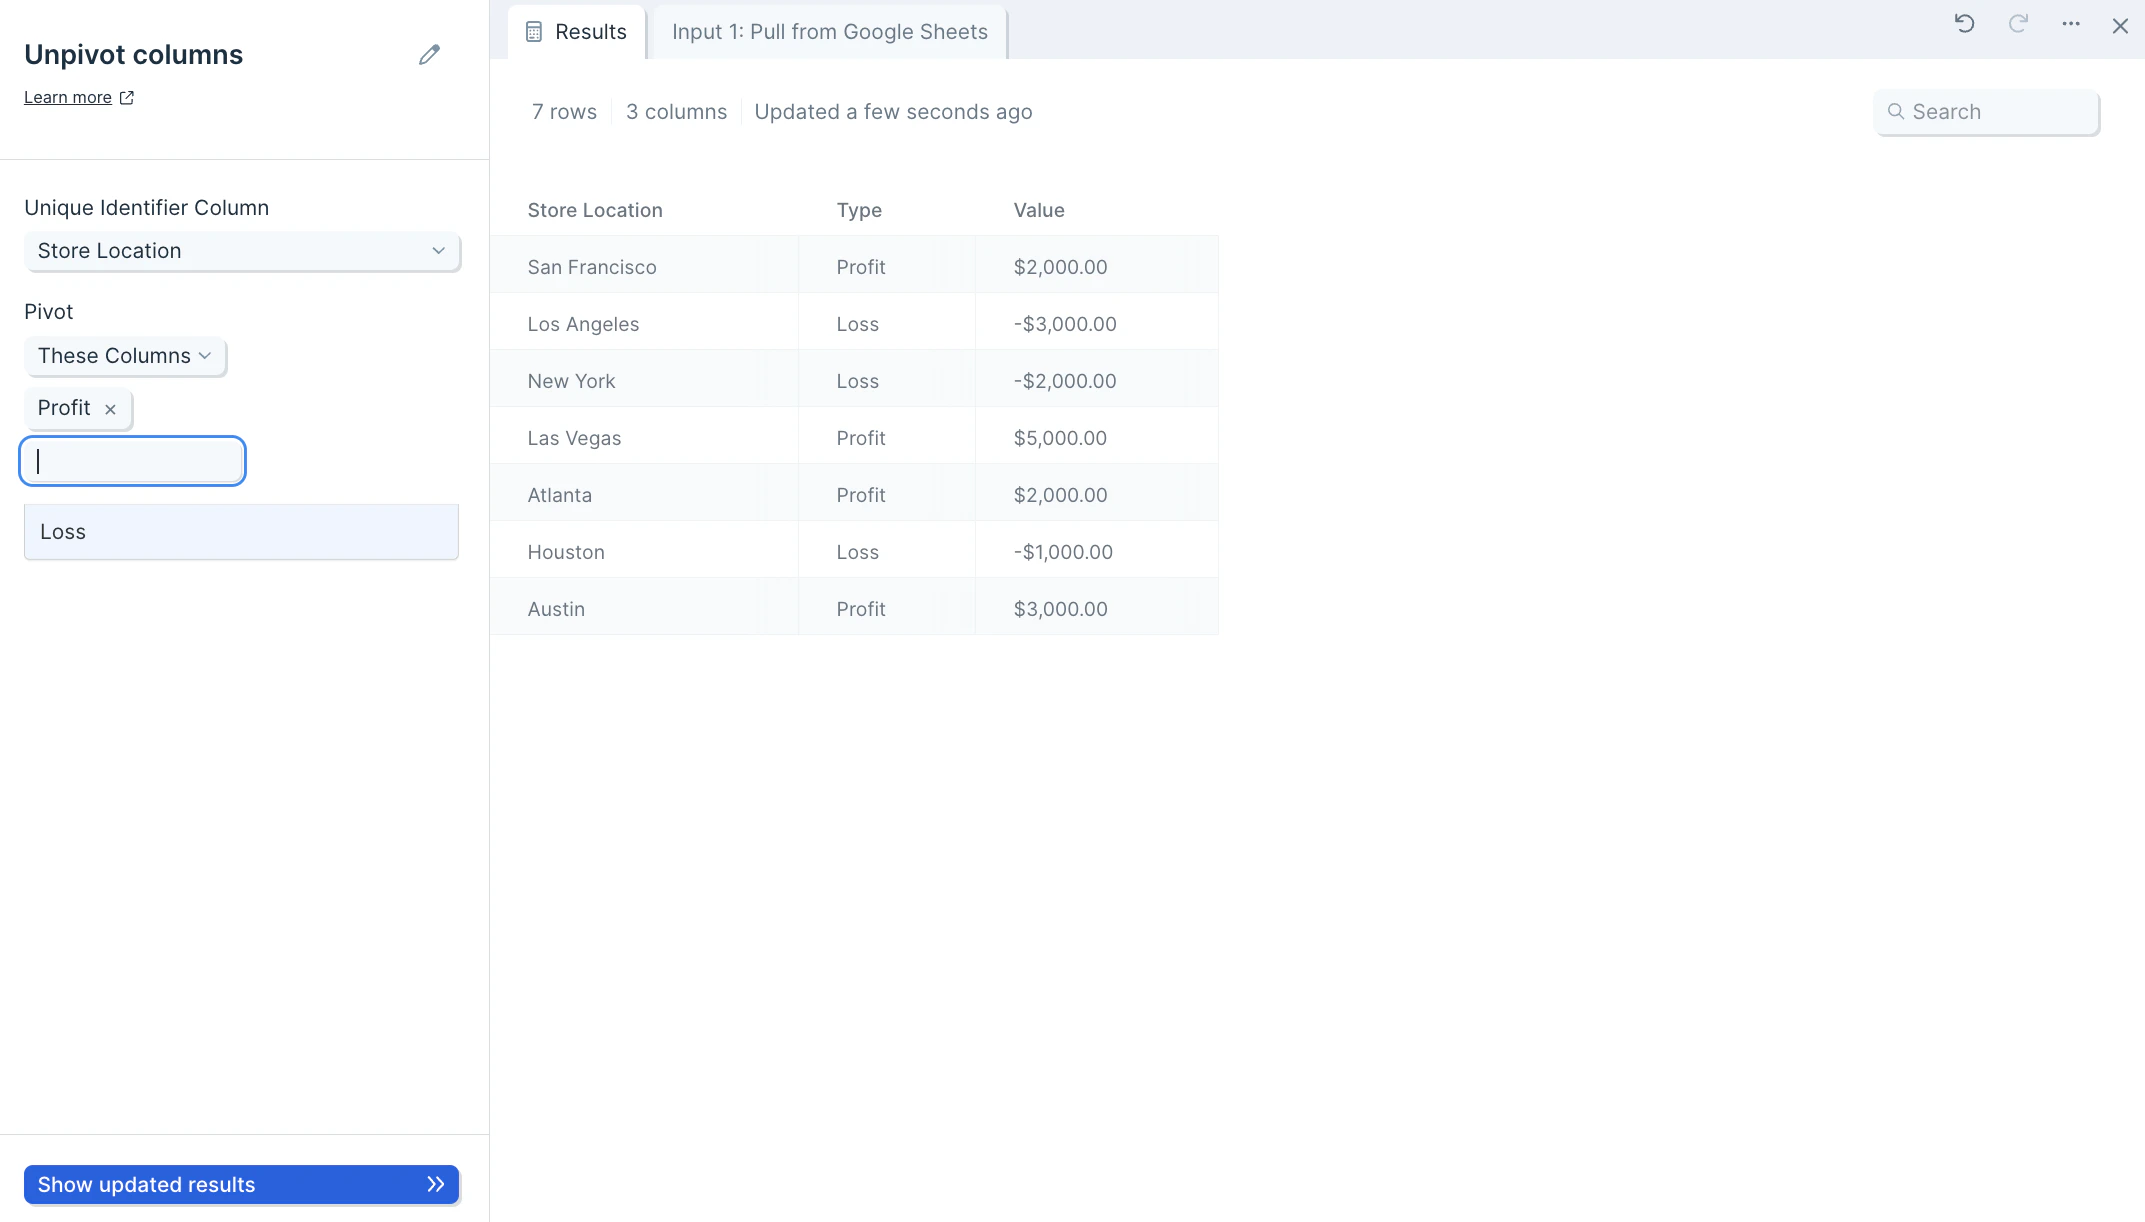
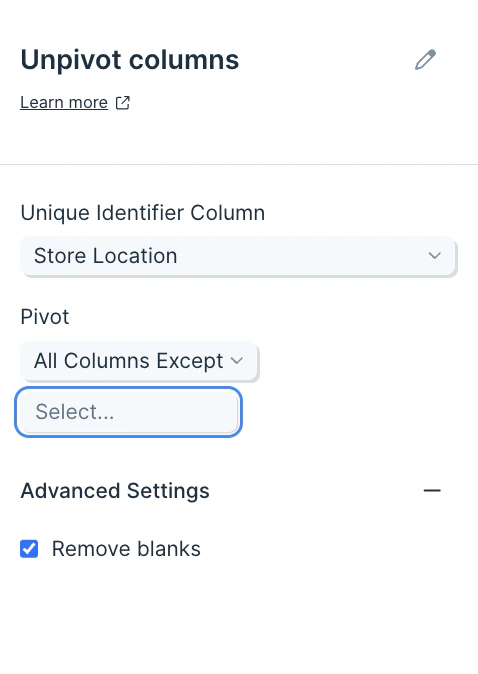
After you connect your data into this step, select the dropdown menu of Unique Identifier Column to choose the column (type of data) you’d like to use as an identifier for this data set. This should be the column you don’t want pivoted, and will be used as a key if the data needs to be pivoted back into shape. This could be a customer ID, store name, store location, customer full name, or more.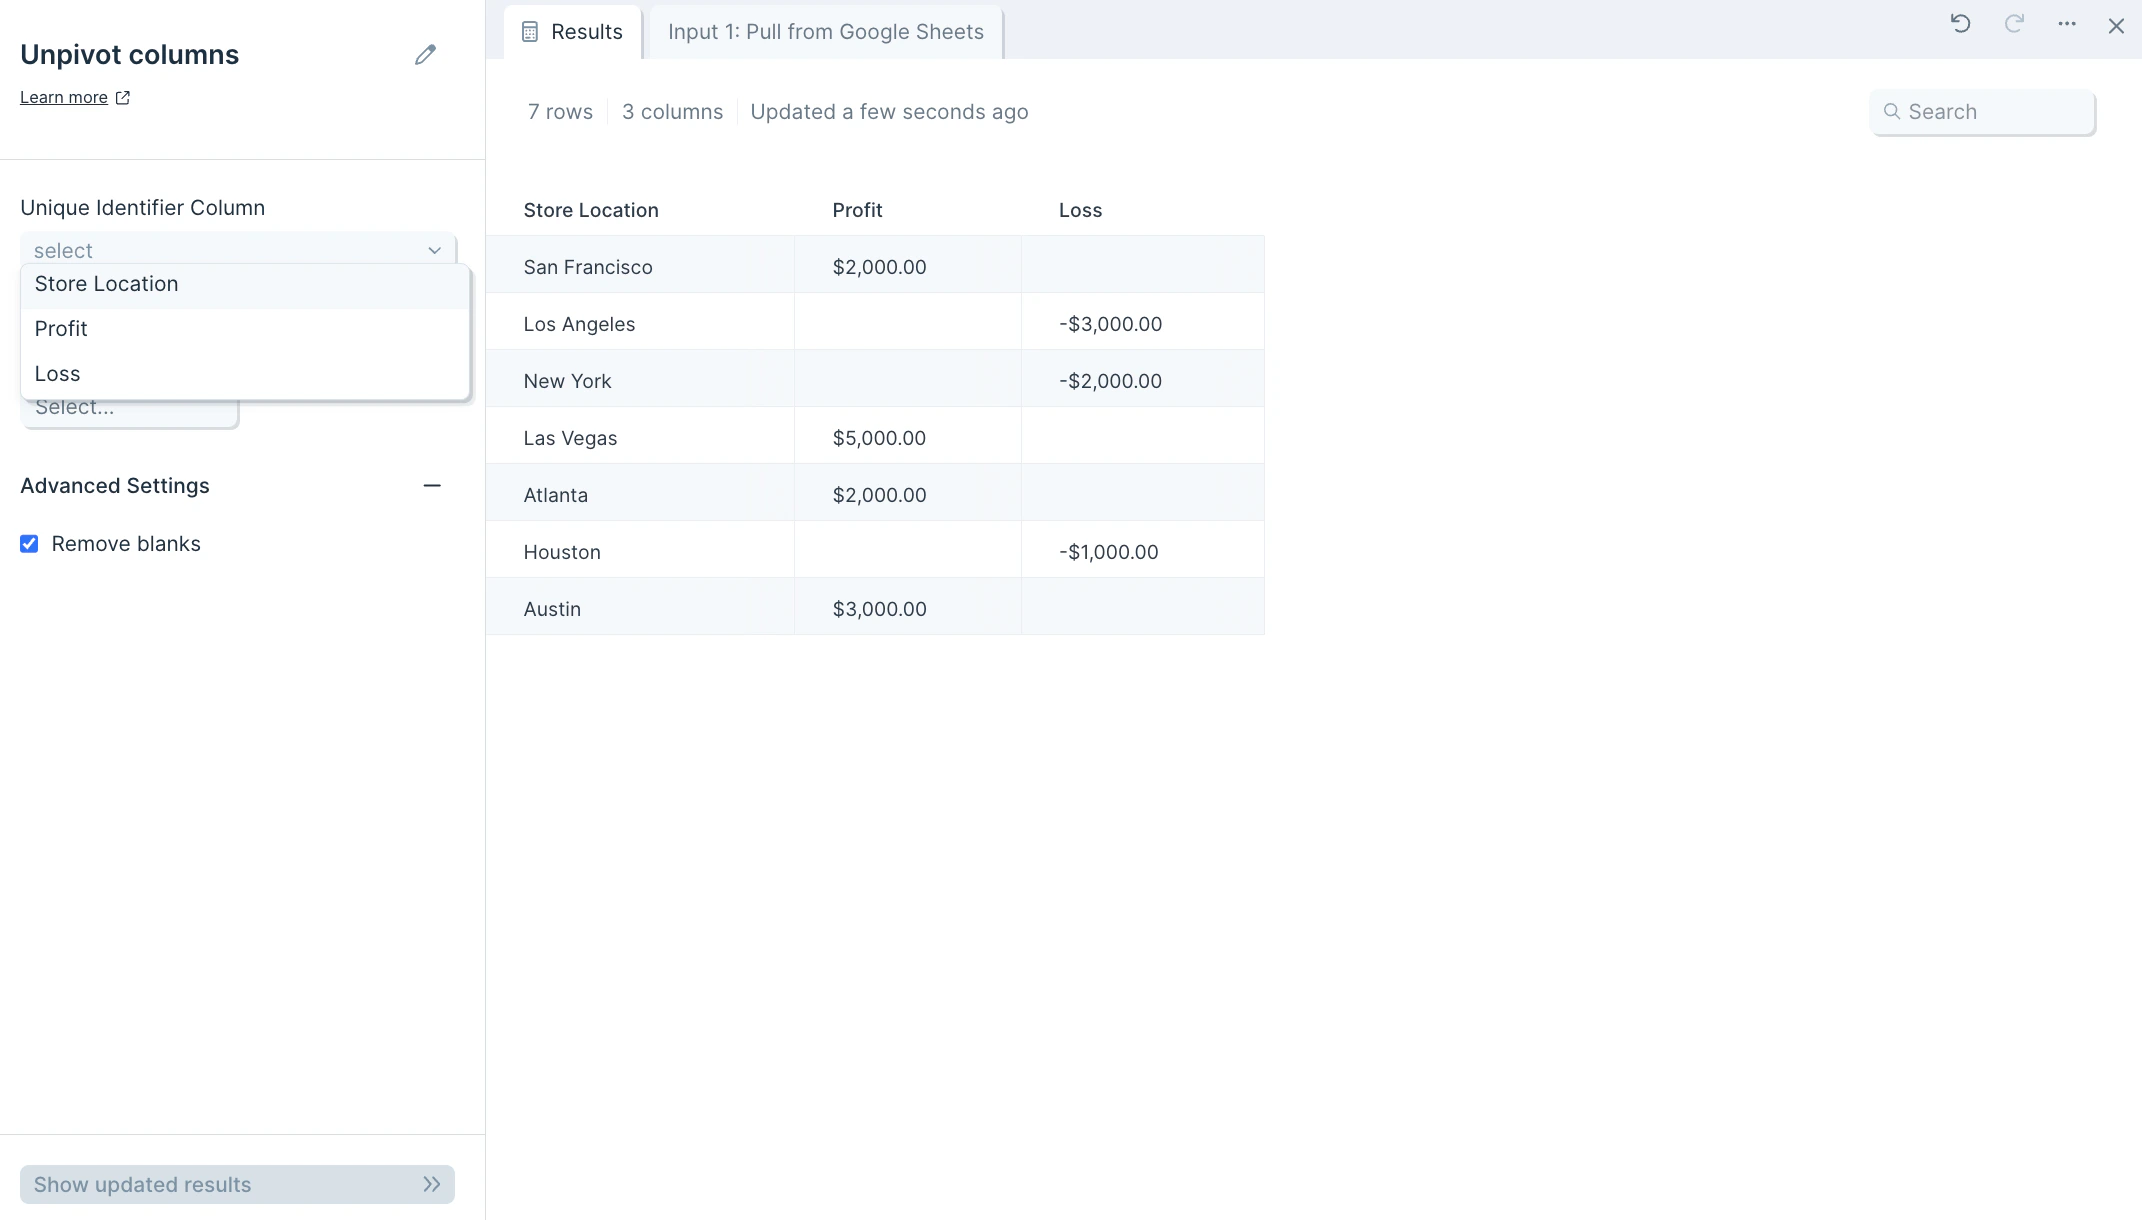
Helpful tips
- Optionally, in the Pivot These Columns section, you can choose to select the columns to exclude from the unpivot operation.
Frequently asked questions
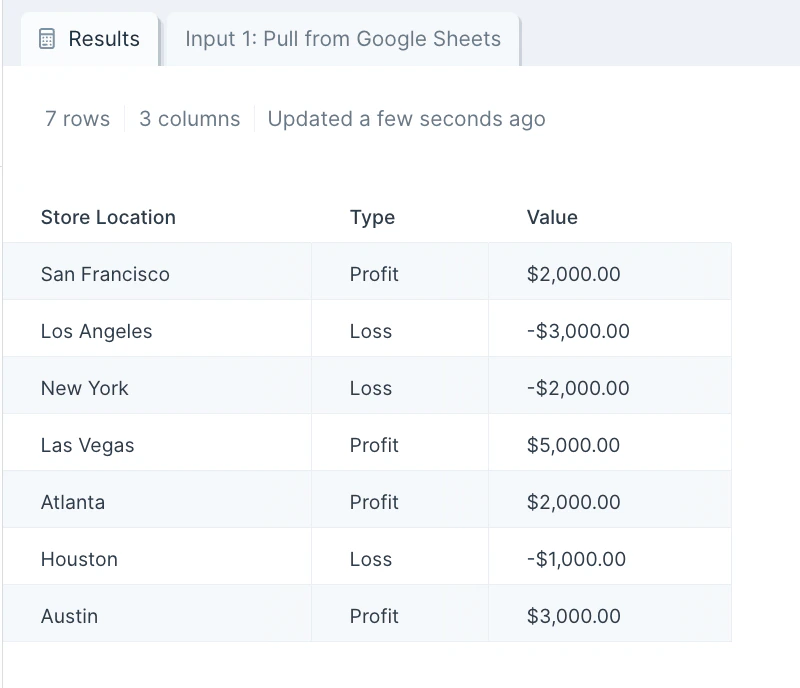
What’s the difference between unpivoting and pivoting? Pivot columns takes values in a column and turns them into headers. Unpivot columns does the reverse — it collapses multiple column headers into a single column of values, producing a longer, narrower table. Why would I need an identifier column? The identifier column is the key that links each unpivoted value back to its source row. Without one, you can’t tell which entity each value originally belonged to. Can I rename the Value and Type columns? The unpivot output uses “Value” and “Type” by default. To rename them, follow this step with Edit columns and apply your preferred names.Related steps
- Pivot columns — reshape long data back into a wide format.
- Stack tables — combine multiple sources by stacking rows vertically.
- Sum by group — aggregate numeric values once they’re in long form.
- Filter rows — narrow the unpivoted output to a specific Type.
- Edit columns — rename the default Value and Type columns.