
Documentation Index

Fetch the complete documentation index at: https://parabola.io/docs/llms.txt

Use this file to discover all available pages before exploring further.

Input/output

The data we’ll connect into this step shows us the change in a specific stock price over time.
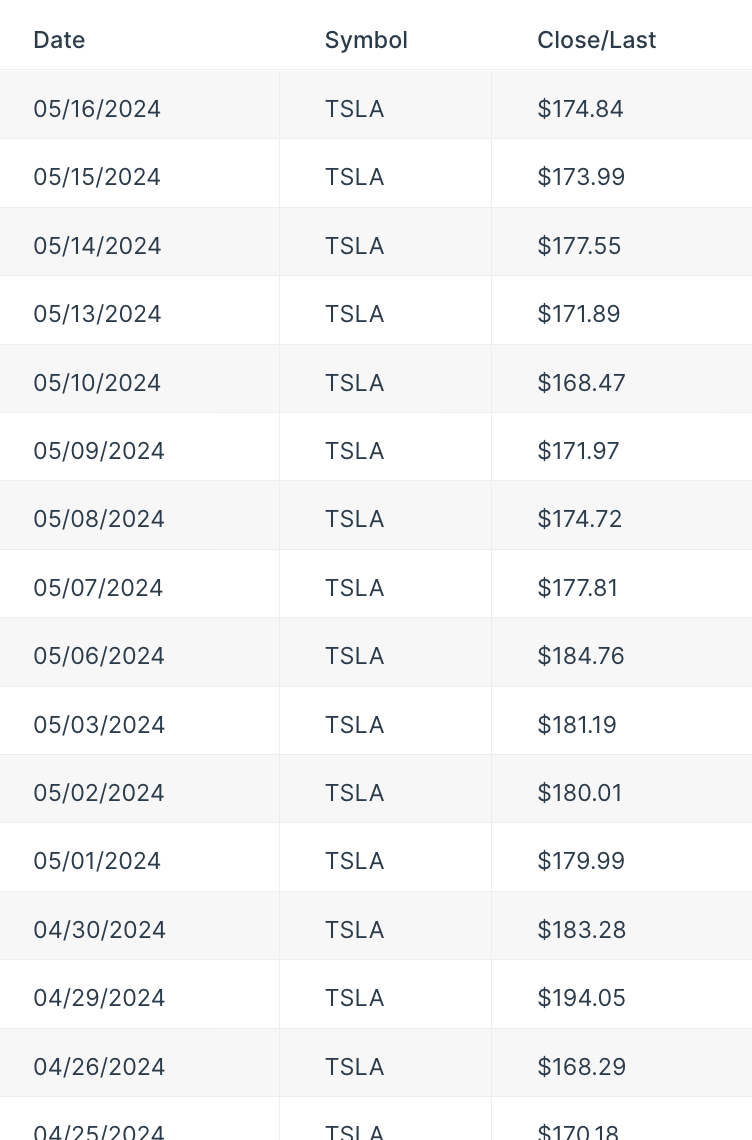
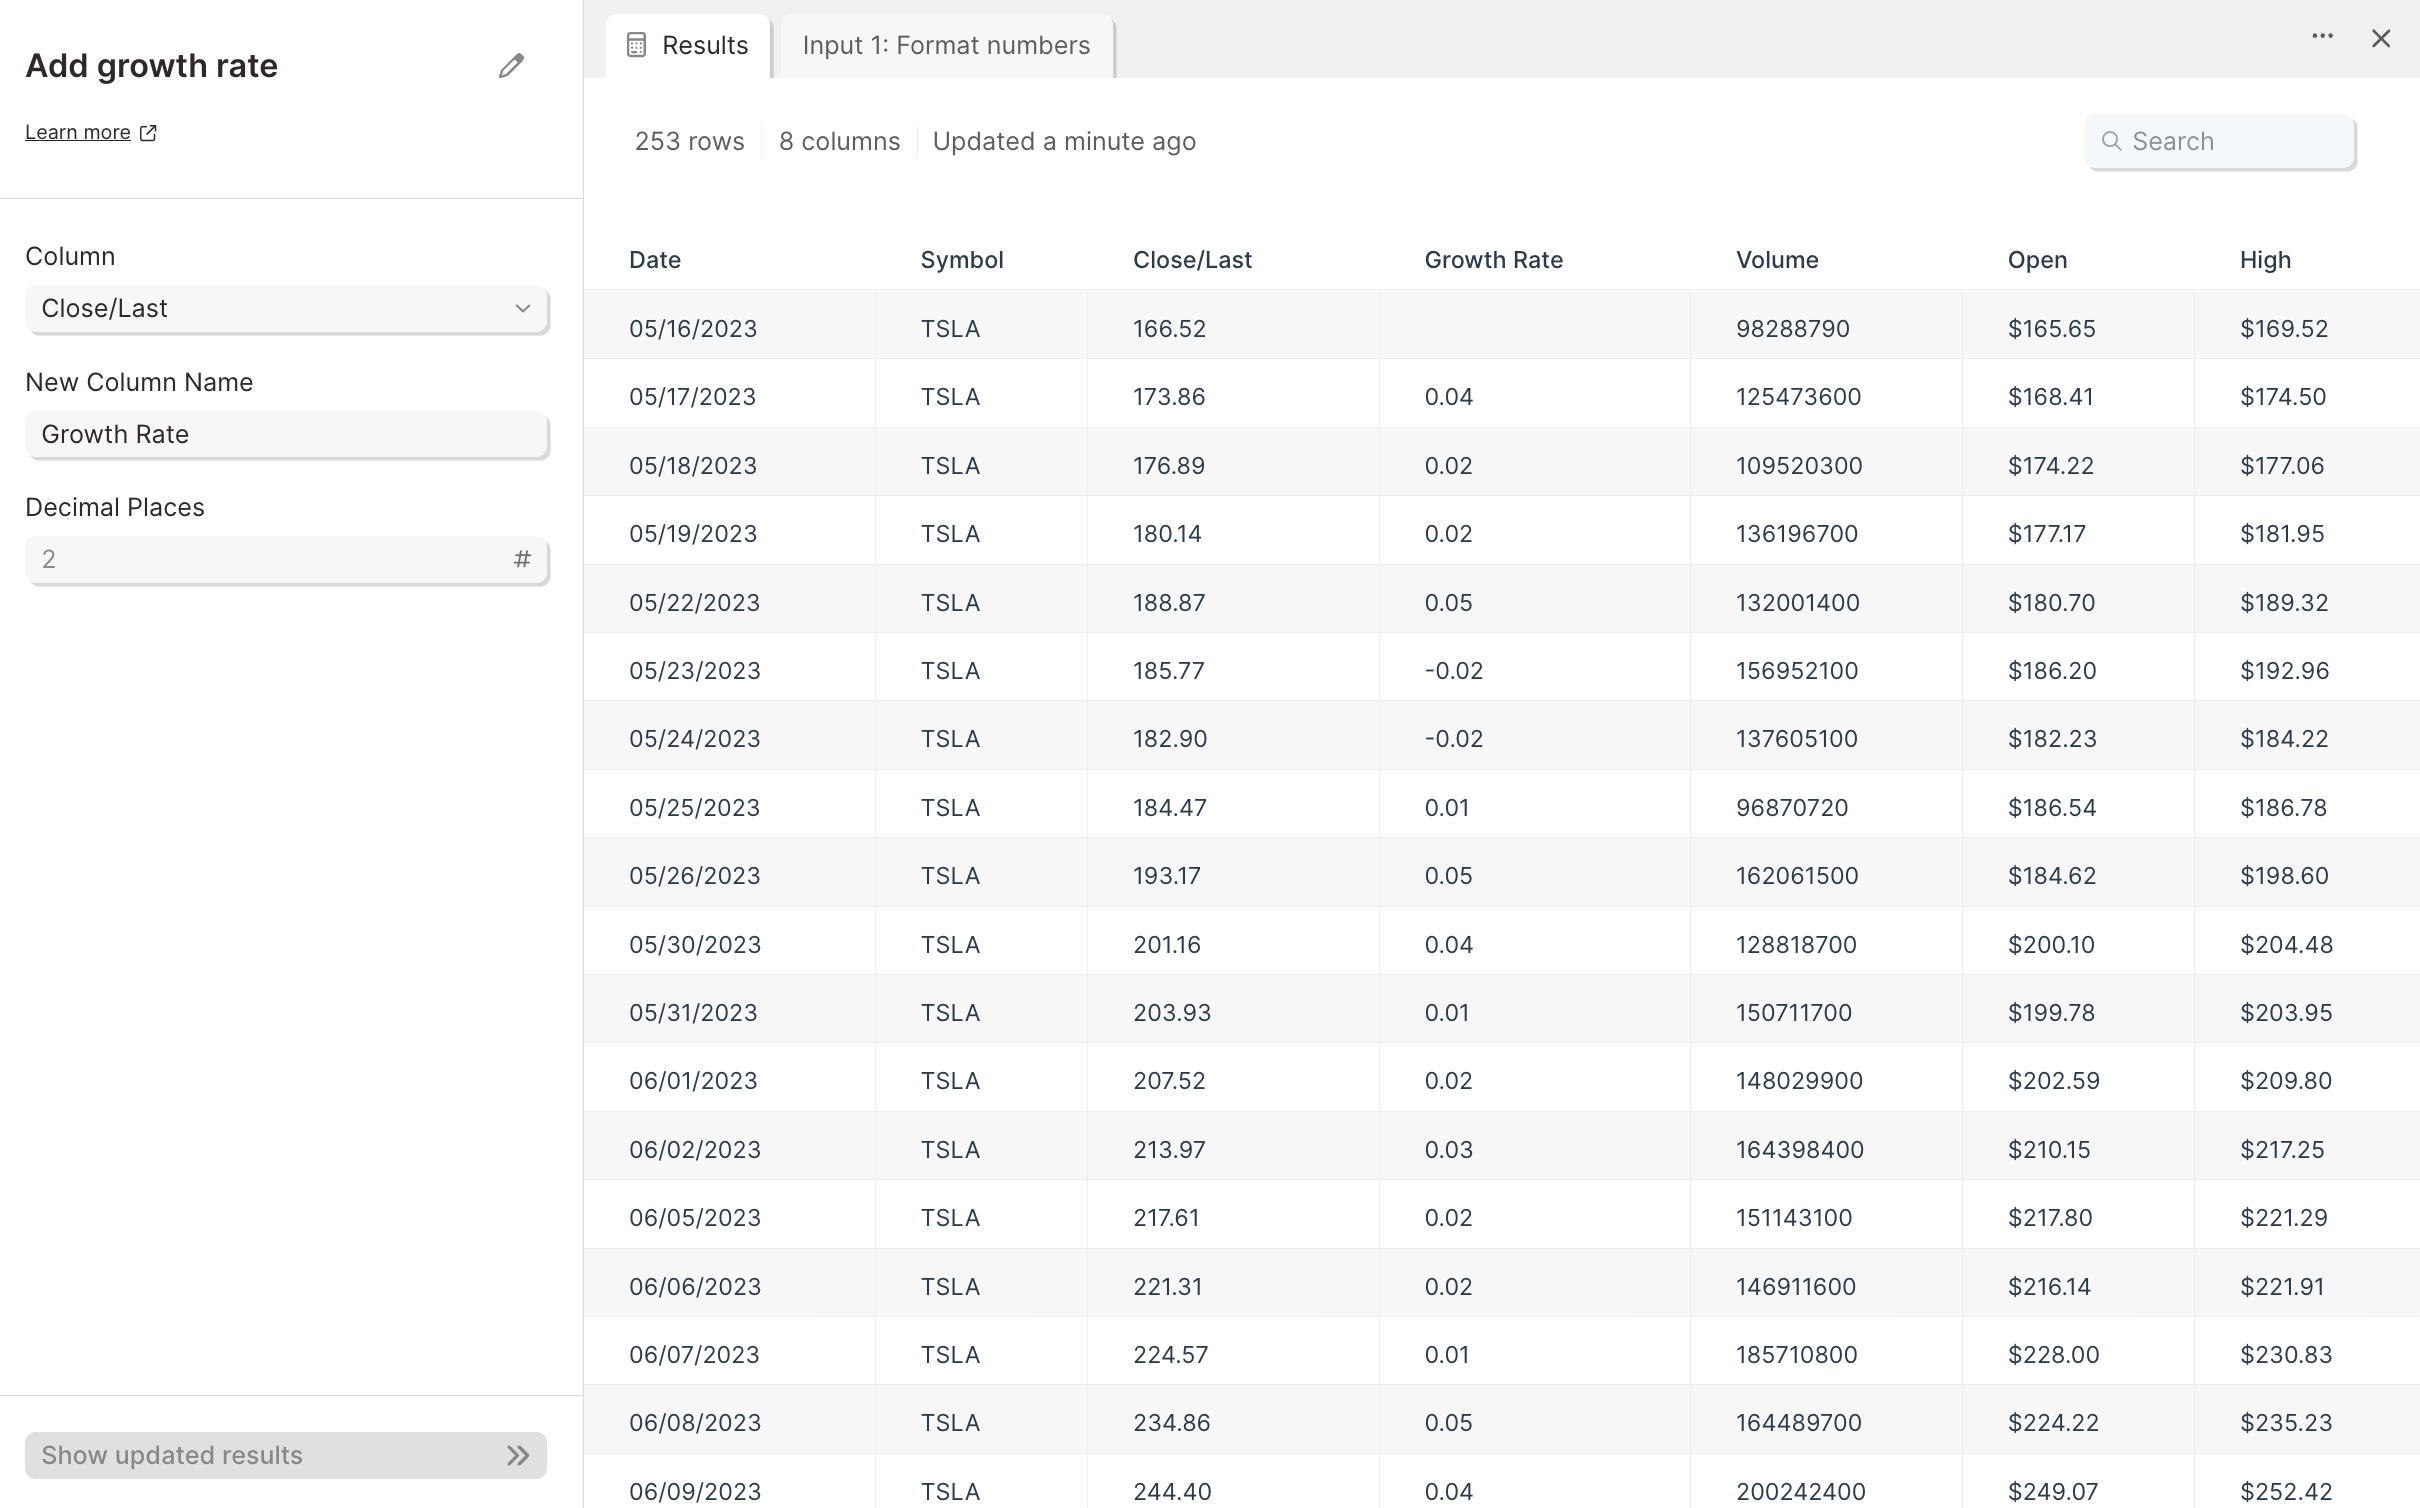
Input table showing stock prices recorded over time
Connecting input data to this step gives us a new ‘Growth Rate’ column, showing the percent change in stock price compared to the prior recorded date.
Output table with a new Growth Rate column showing the percent change between rows

Custom settings

First, select the column that you’d like to calculate the growth rate of.
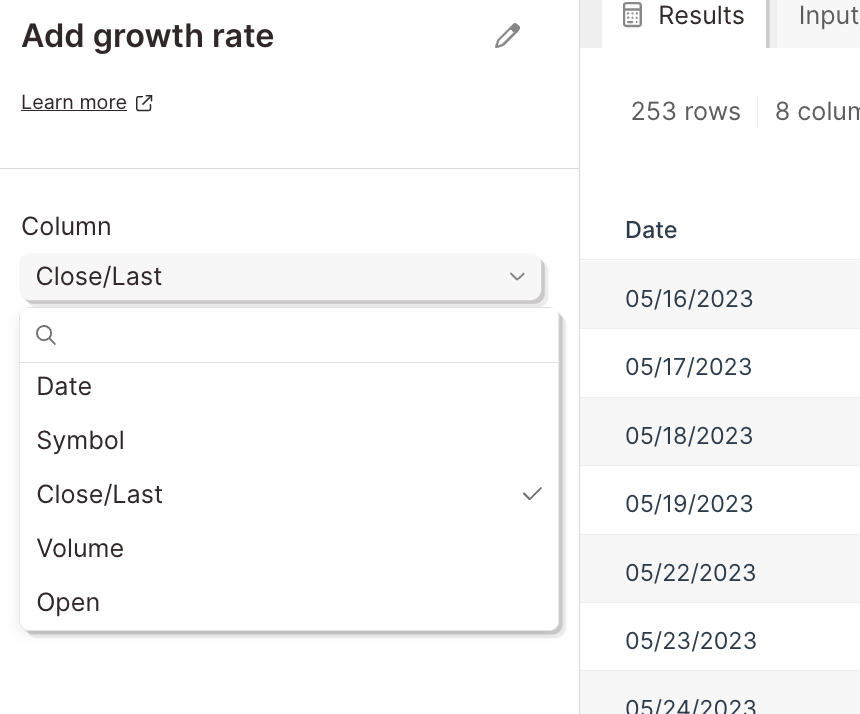
Add growth rate step settings with the source column dropdown selected
Then, under ‘New Column Name’, title your new column. In the ‘Decimal Places’ field, input the number of decimal places you want included in the calculation. Finish by selecting the button ‘Show Updated Results’ to save and display your new output data. Your table now has a column inserted to the right of the column whose growth it’s calculating. This new column will display the percent change from row to row, in decimal format.
  • Add running total — track cumulative sums alongside row-over-row growth.
  • Add math column — calculate other derived metrics from the same numeric column.
  • Format numbers — display the growth rate as a percent or with set decimal places.
  • Sort rows — order rows chronologically before calculating growth.
  • Sum by group — aggregate values by period before computing growth.
Last modified on May 18, 2026