Documentation Index
Fetch the complete documentation index at: https://parabola.io/docs/llms.txt
Use this file to discover all available pages before exploring further.
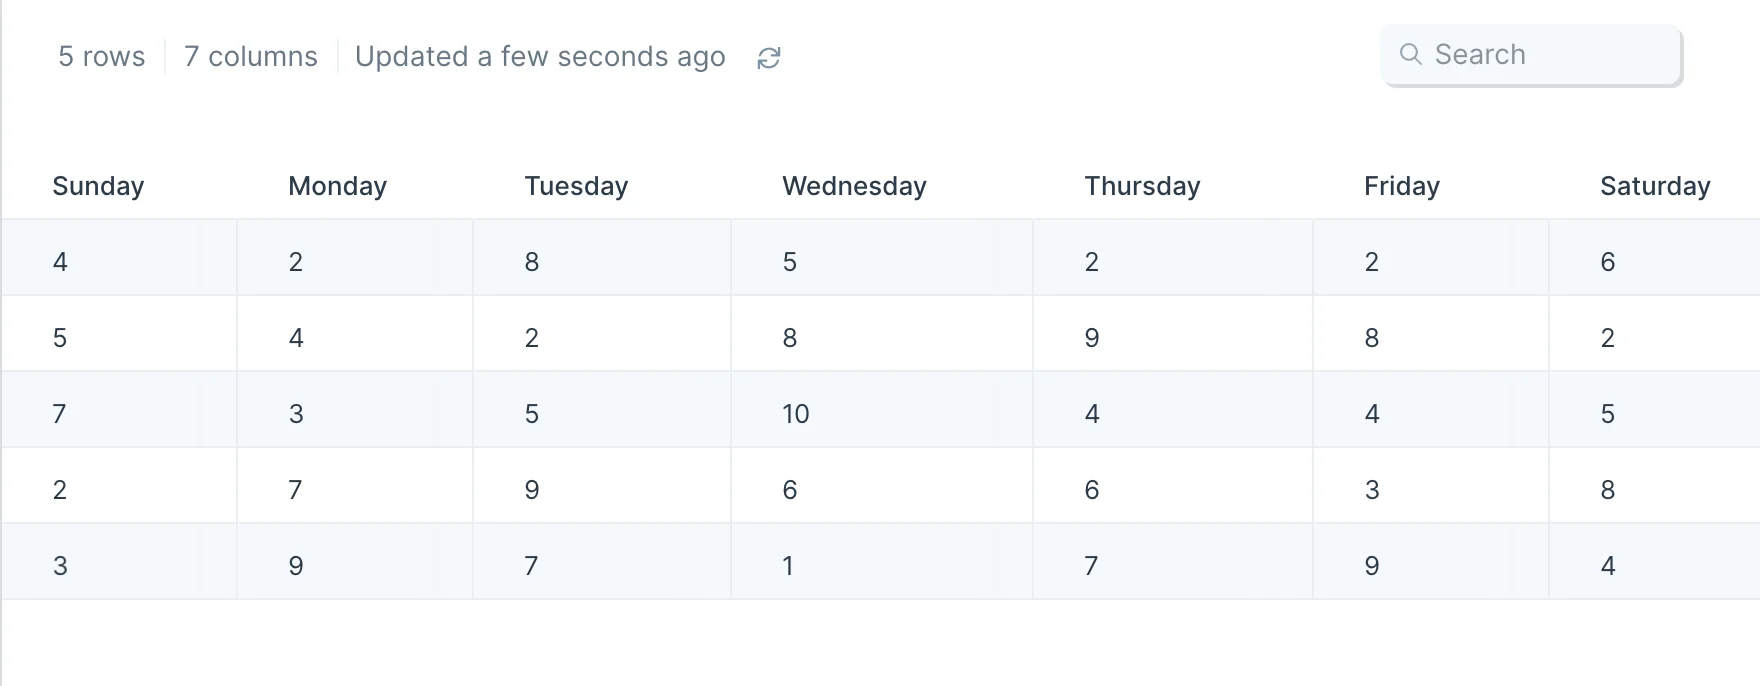
Our input data shows how many items we sold on a given day.
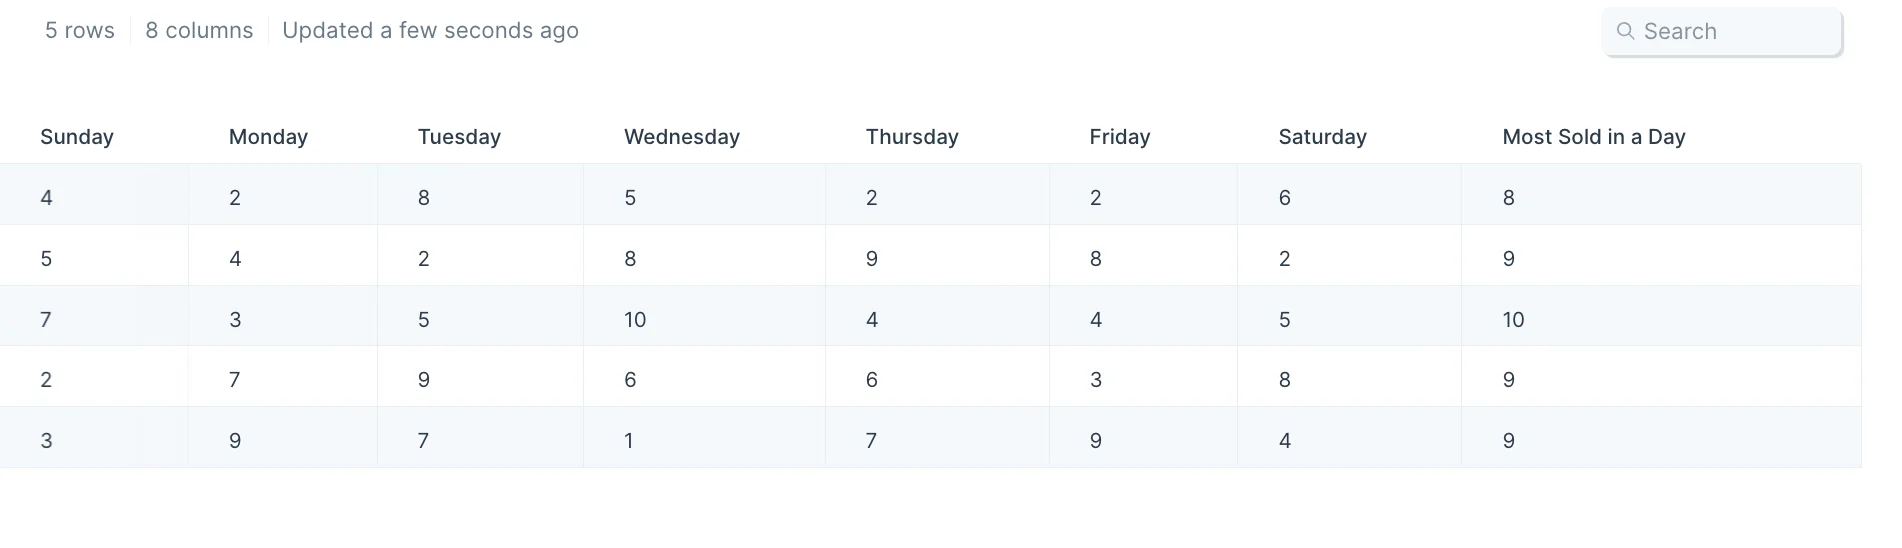
We can use this step to produce an output with a new column at the right side, called ‘Most Sold in a Day,’ which contains the maximum value in each row.
Default settings
This step will automatically generate an ‘Untitled’ column after data is connected to it.
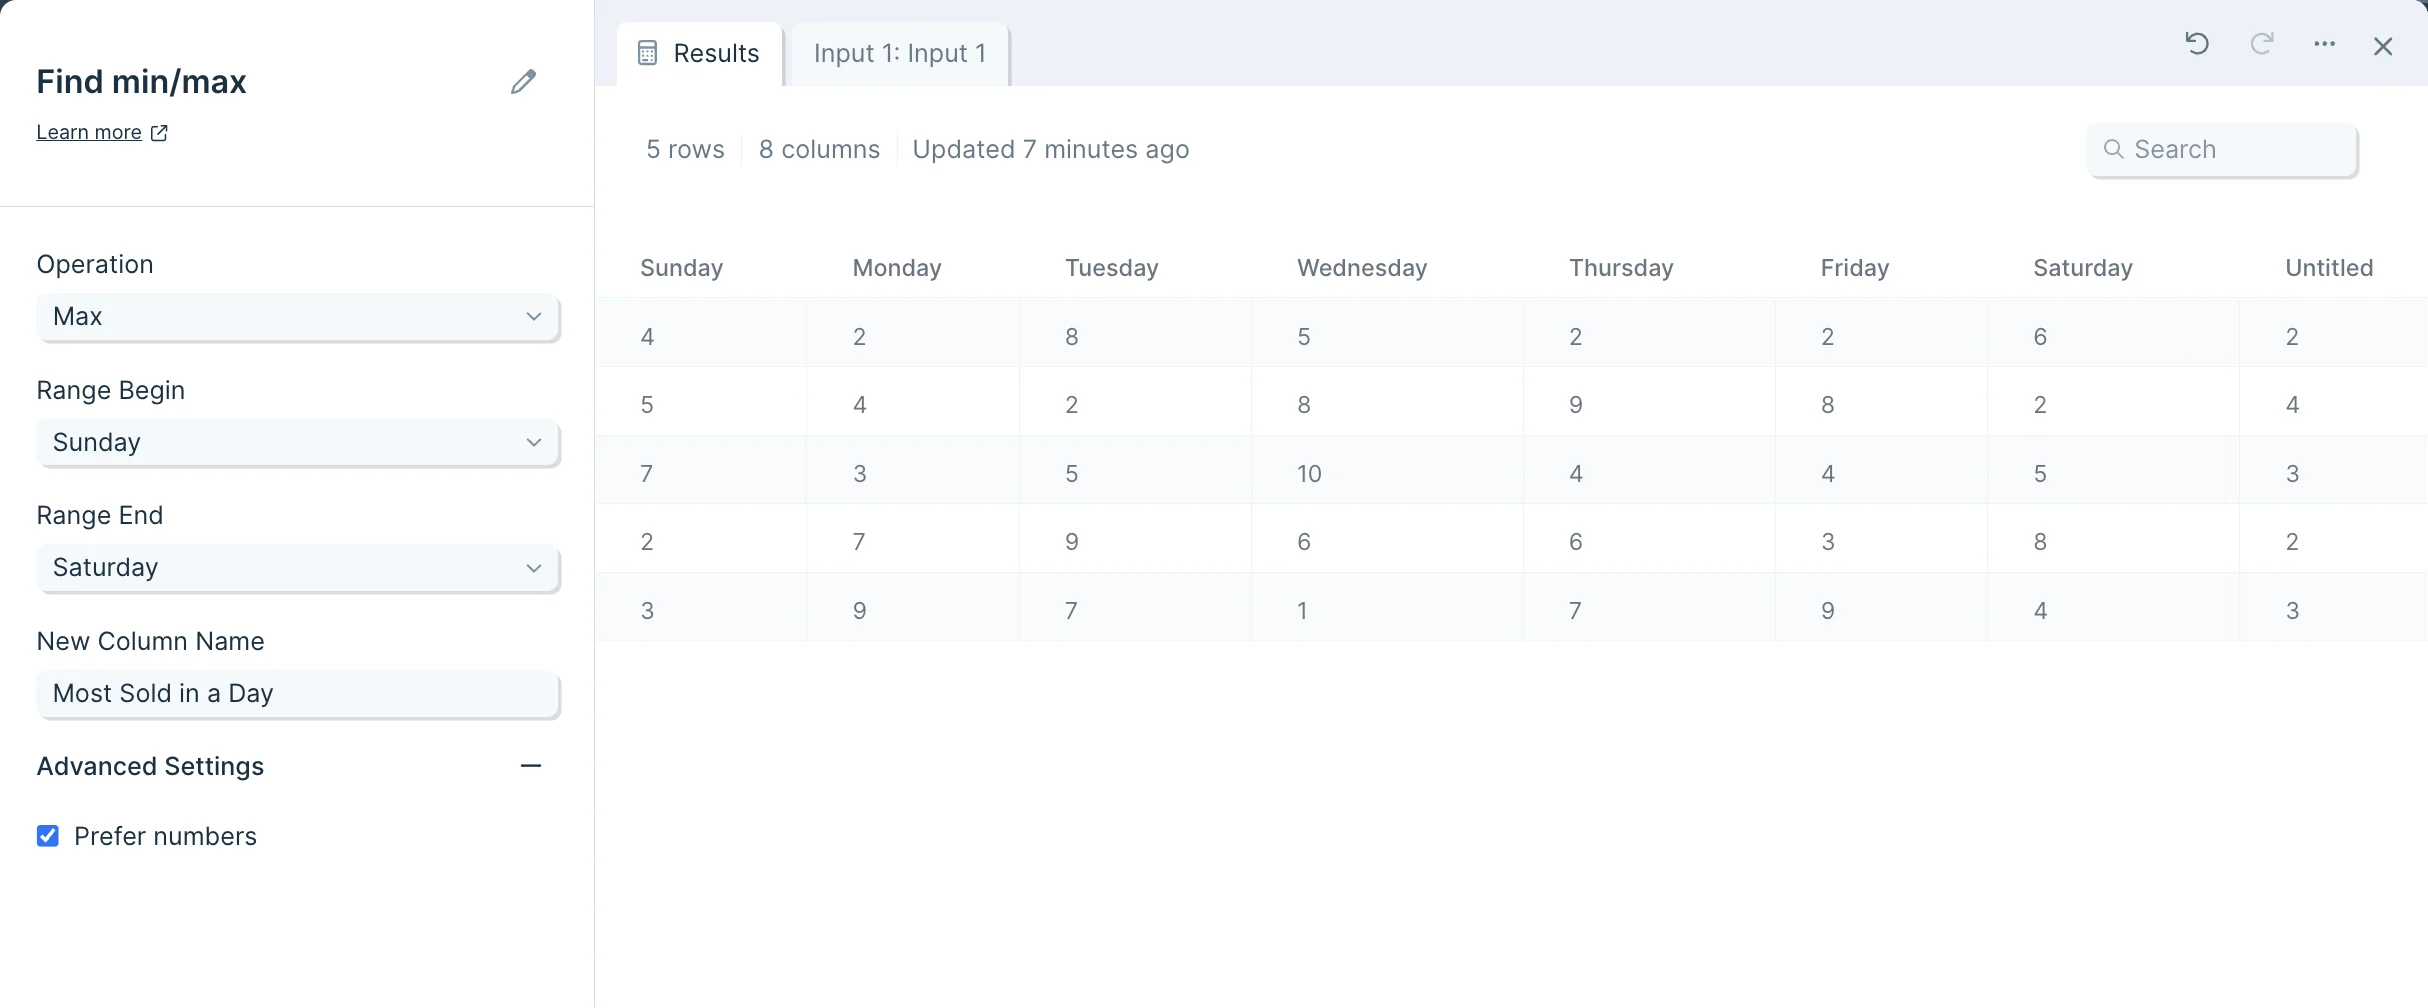
Custom settings
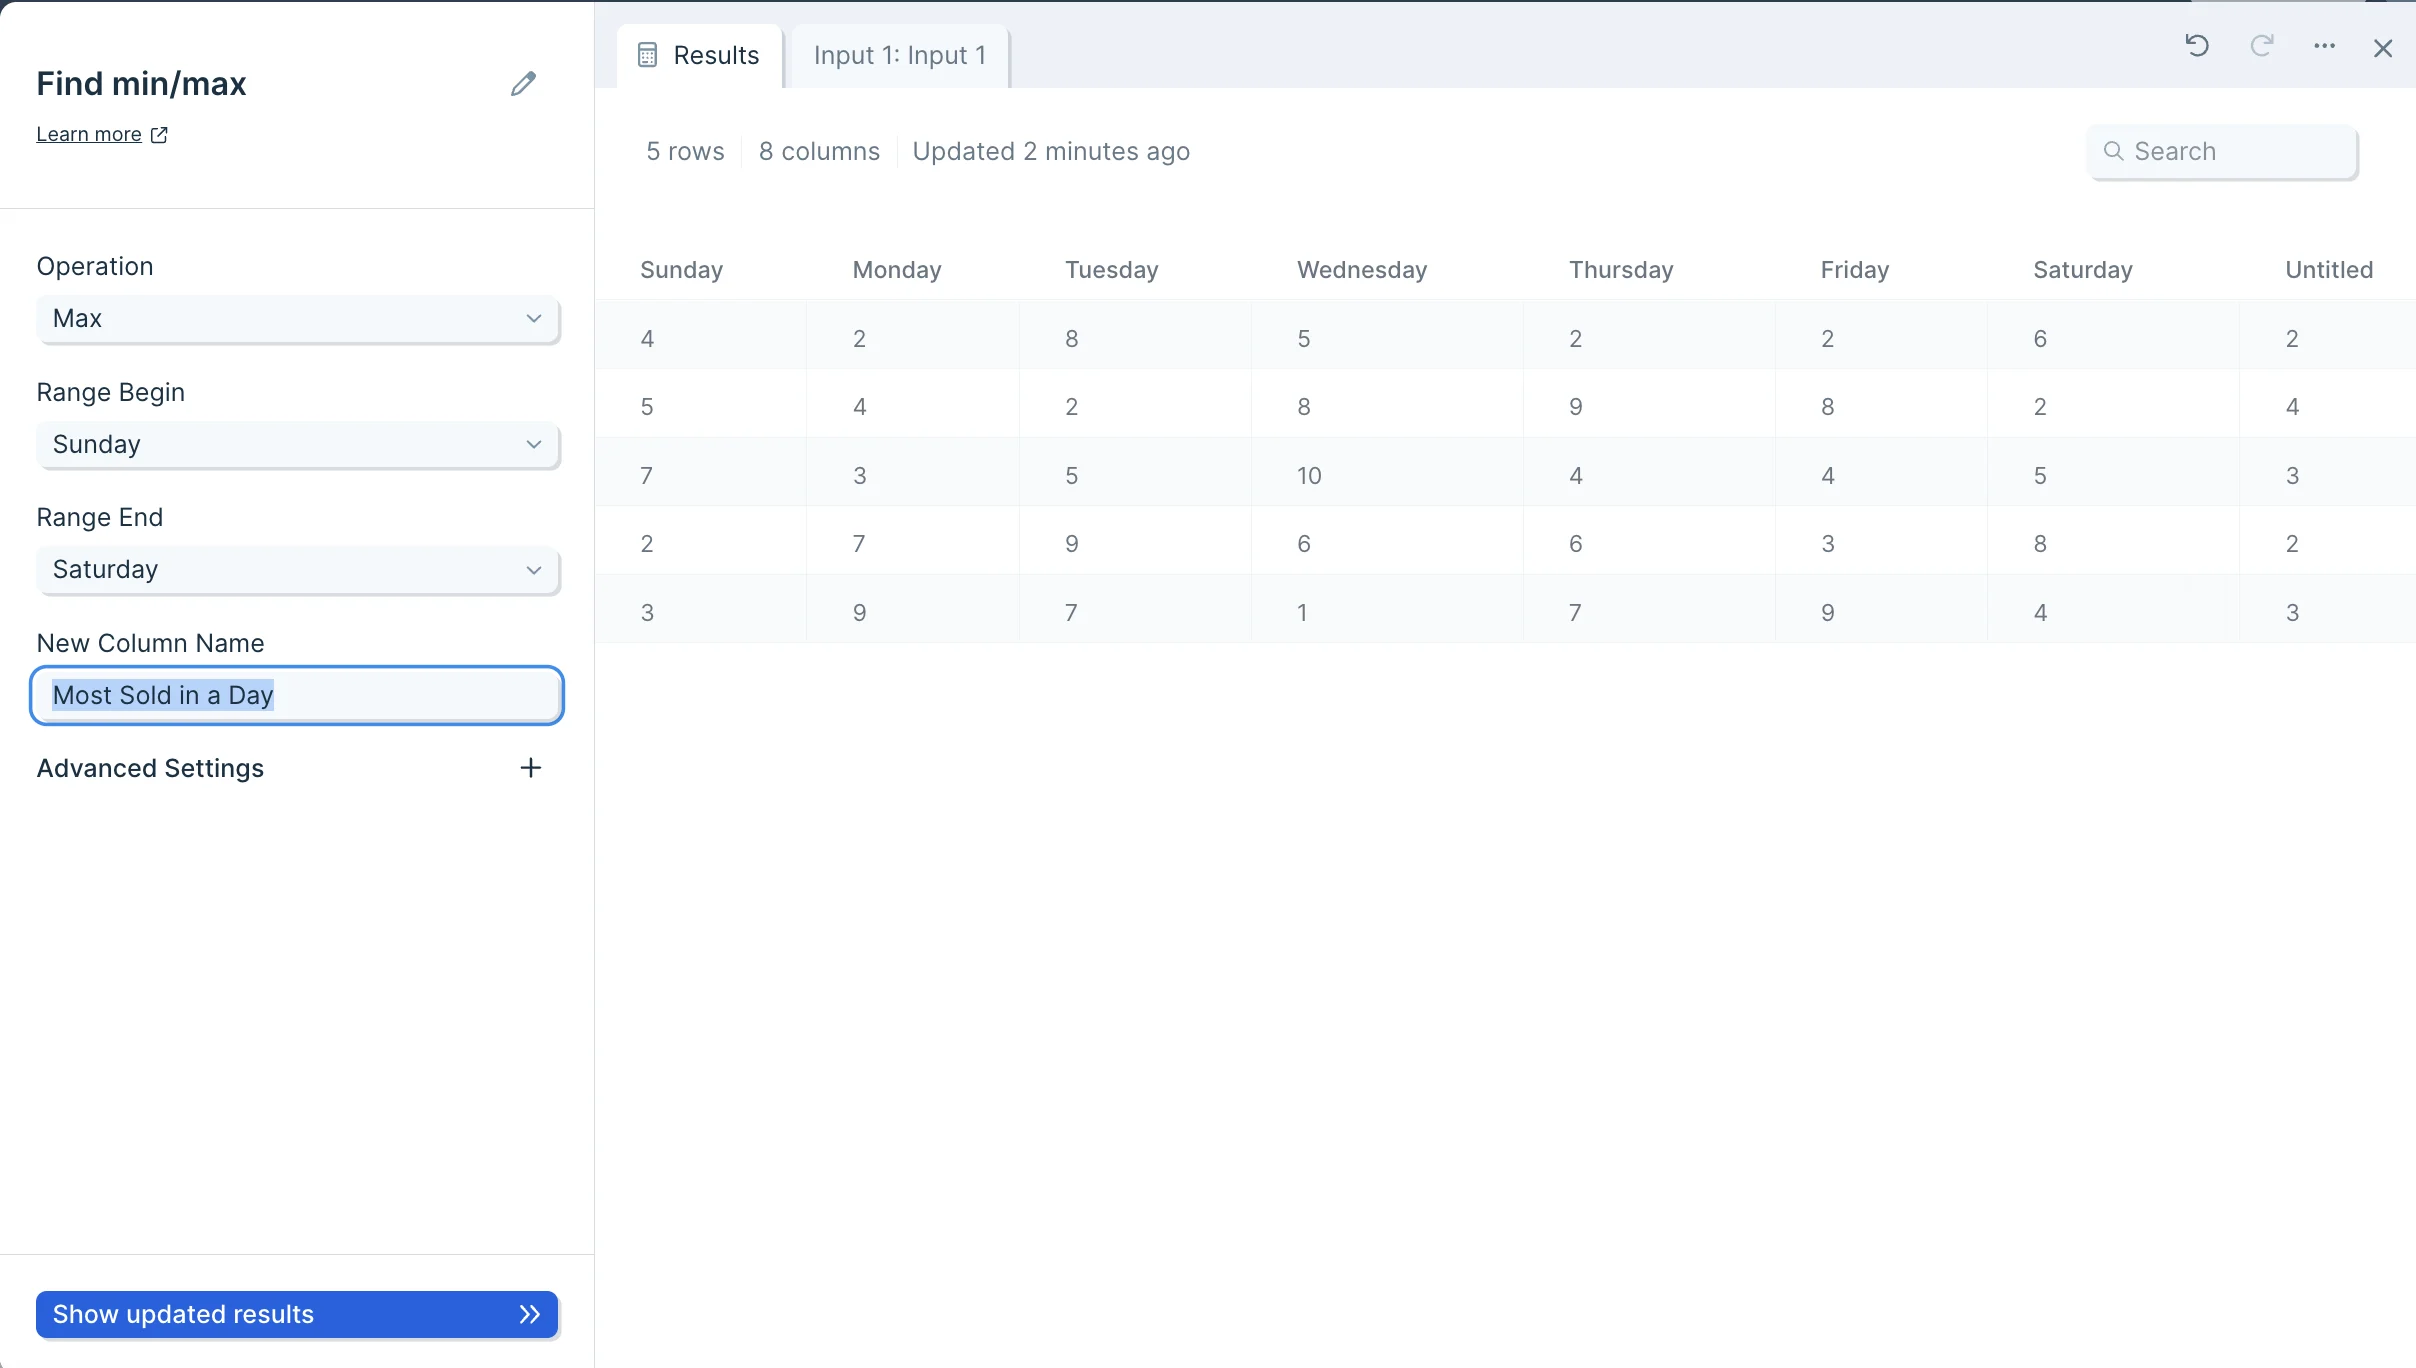
In the left-side toolbar, first choose in the ‘Operation’ dropdown menu whether our new column should show the ‘Min’ or the ‘Max’.
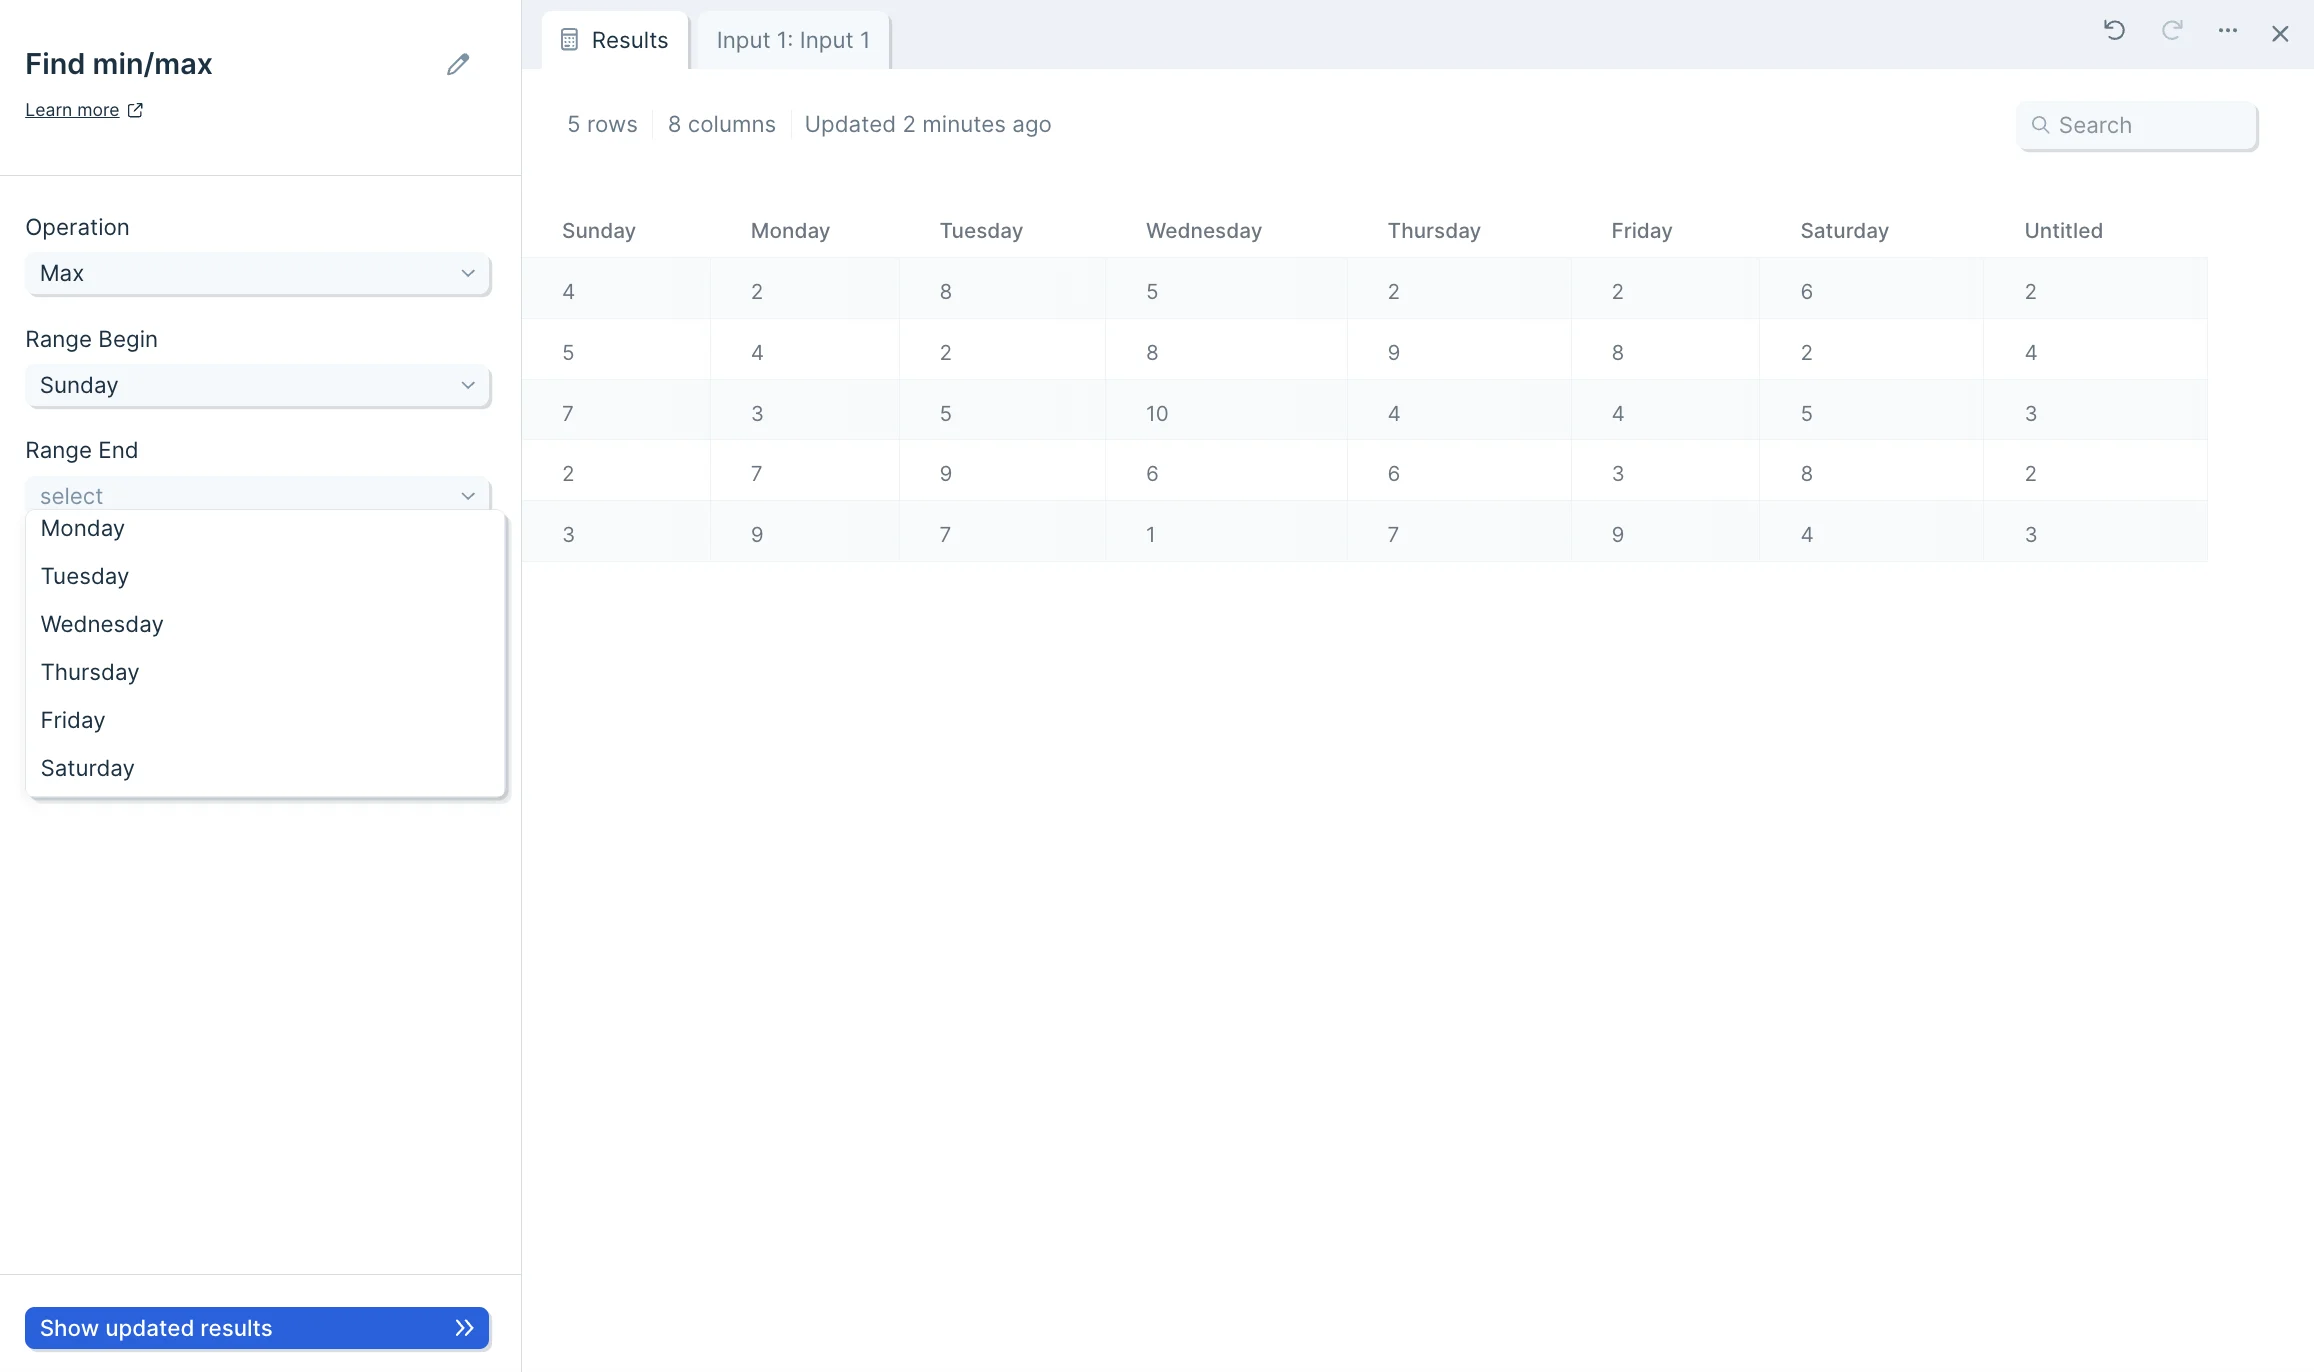
Then choose the columns to operate on by selecting values under ‘Range Begin’ and ‘Range End’.
After this, name your new column and click ‘Show updated results’ at the bottom to save.
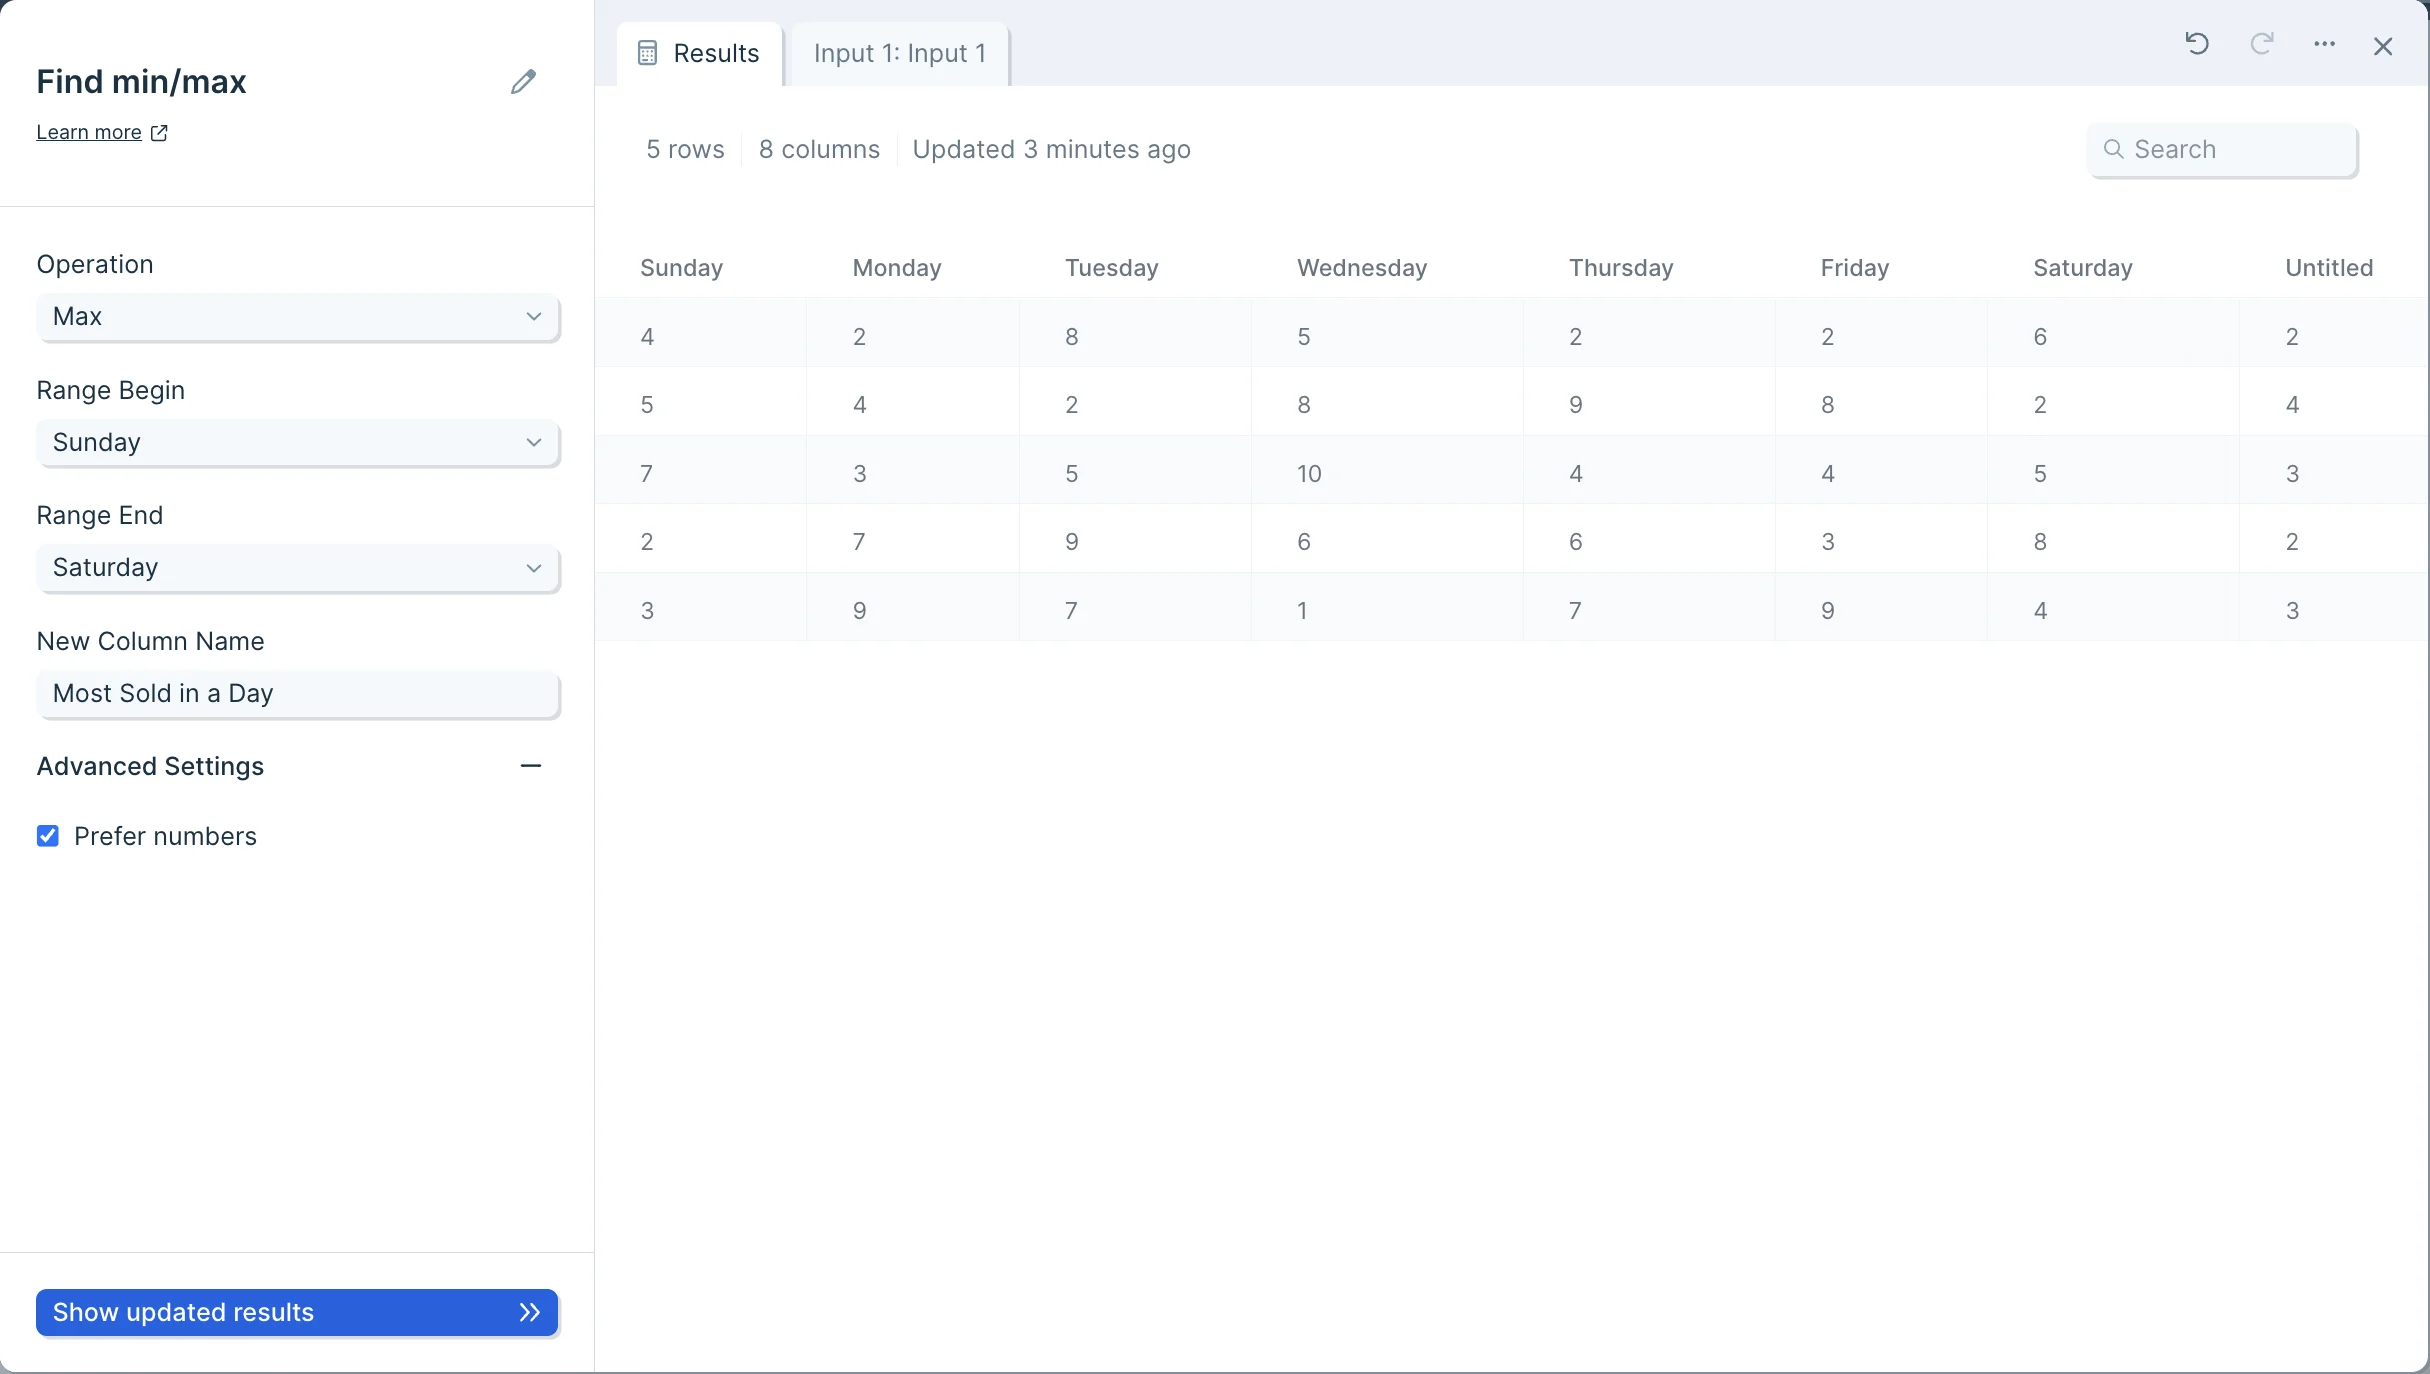
There is an advanced settings menu that you can expand. By default, the box is checked to ‘Prefer numbers’ when running your operation. You can deselect this option, but we recommend leaving it on.
Your table will now have a column appended, displaying the minimum or maximum value per row, within the columns in your selected range.