Documentation Index
Fetch the complete documentation index at: https://parabola.io/docs/llms.txt
Use this file to discover all available pages before exploring further.
Input/output
In this example, the input data we’ll use has orders information that displays the units sold per product variant. However, our columns are in a randomized order that’s difficult to understand quickly.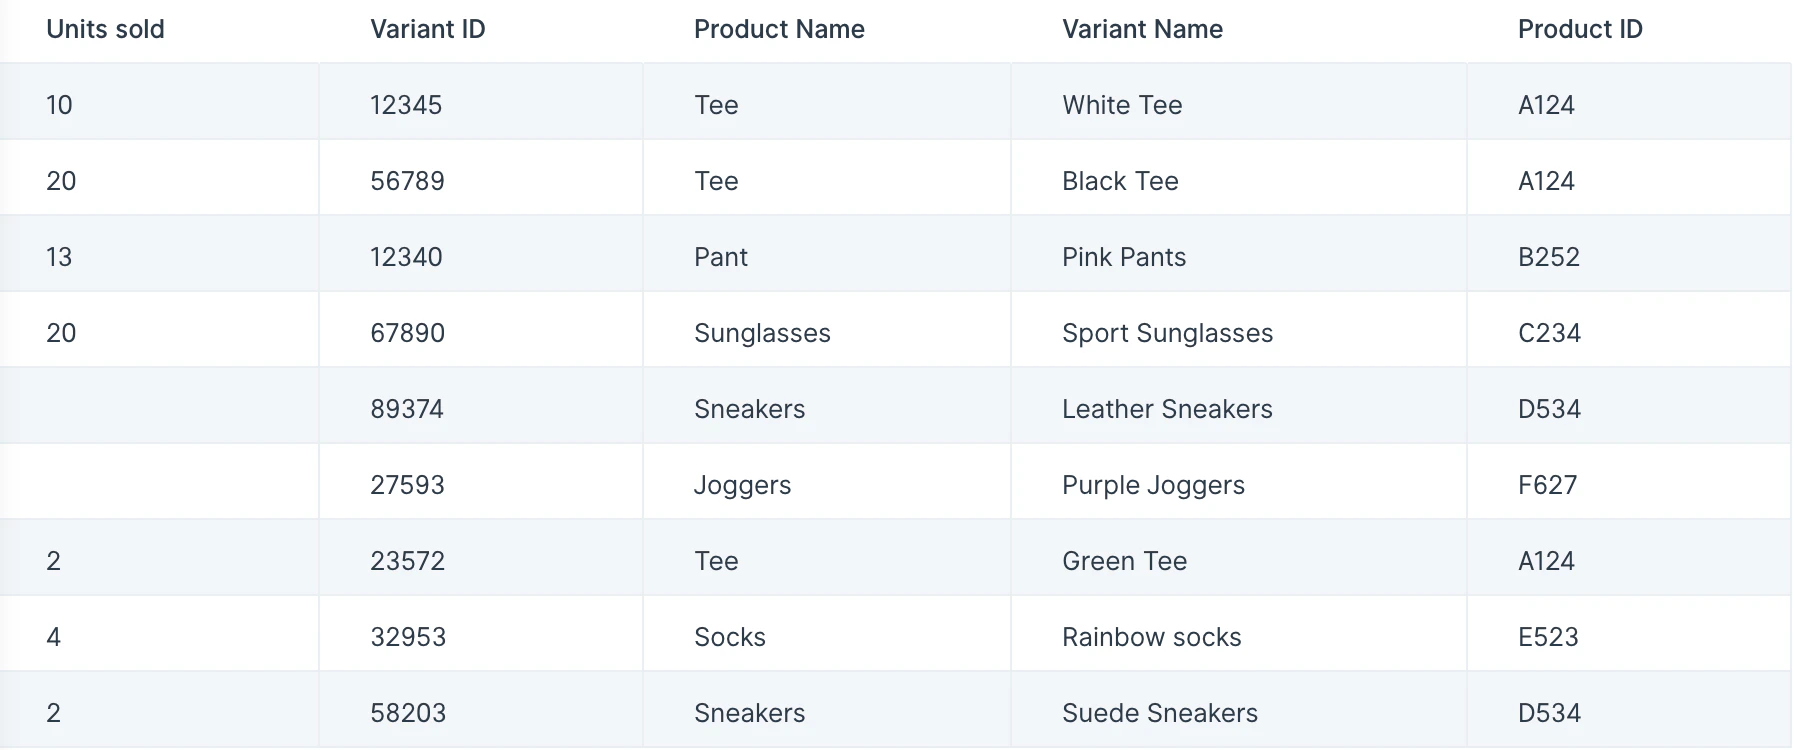
Custom settings
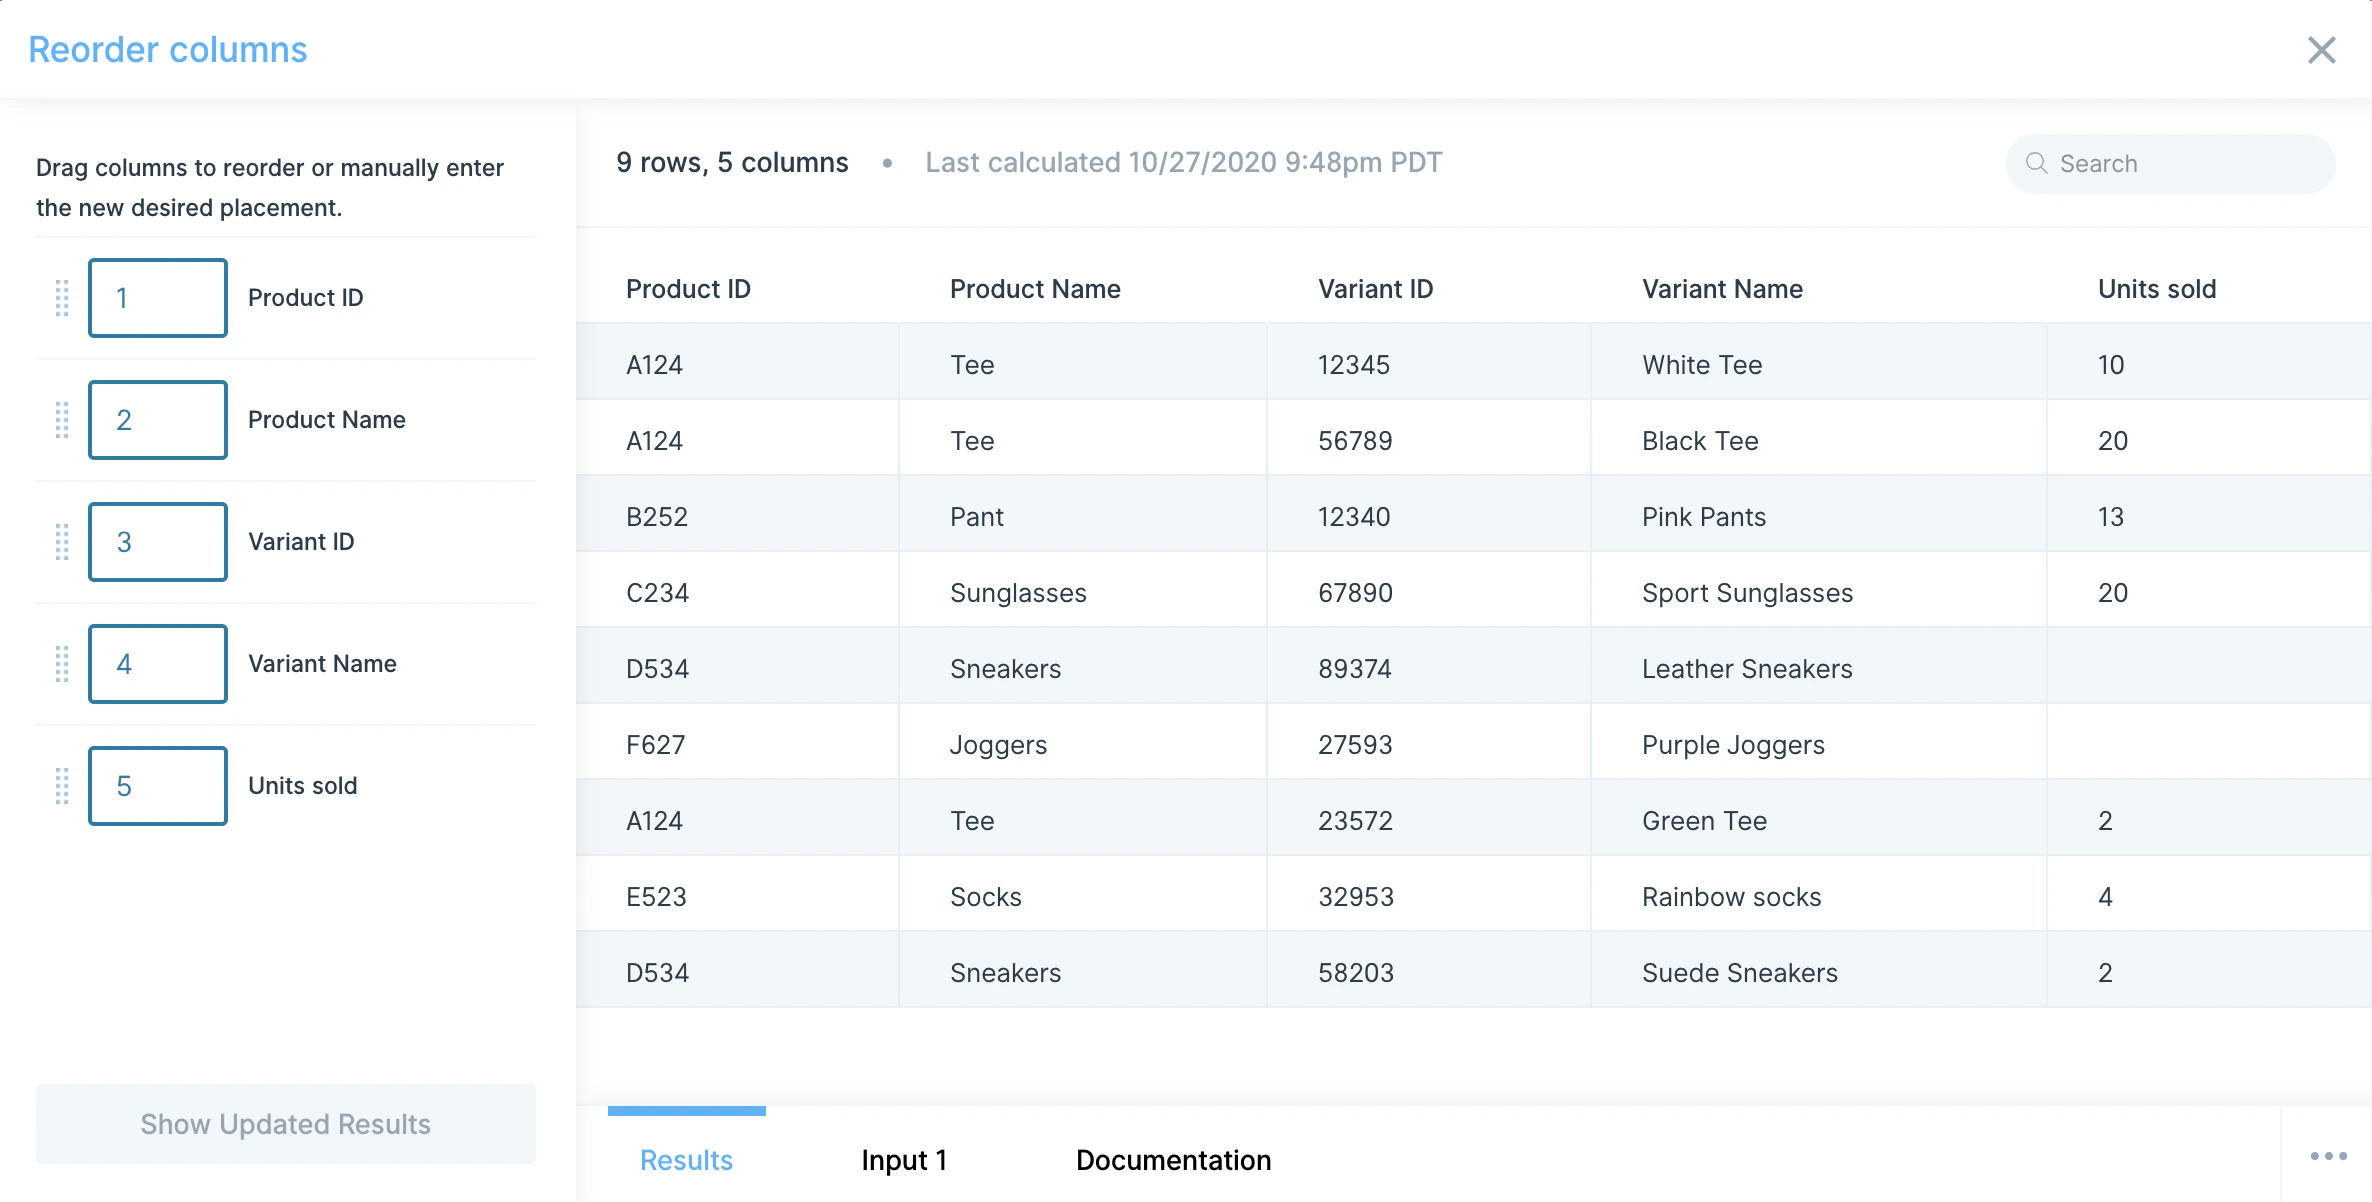
When you first connect your data into the Reorder columns step, it’ll display your columns in their original order. You can click down on a specific column and drag it into the desired placement. You may also type in a number representing the position of the column. The placement of the other columns will automatically update based on your input.Related steps
- Edit columns — the consolidated step that now includes reordering, renaming, and selecting columns.
- Select columns — keep or remove columns from the dataset.
- Combine columns — merge two or more columns into one.
- Split column — divide a single column into multiple columns.